|
※サムネイル画像をクリックすると拡大画像が表示されます。
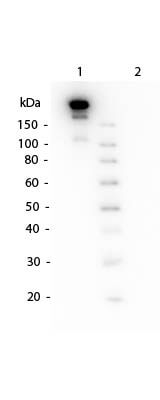
Western Blot of Mouse TrueBlotR ULTRA: Anti-Mouse Ig HRP. Lane 1: Mouse IgG, non-denatured. Center Lane: 5 μL Opal Pre-stained Ladder (p/n MB210-0500). Lane 2: Mouse IgG, denatured. Load: 50 ng. Primary antibody: none. Secondary antibody: Mouse TrueBlotR ULTRA: Anti-Mouse Ig HRP at 1:1,000 for 60 min at RT. Block: MB-070 for 30 min at RT. Predicted/Observed size: >160 kDa non-denatured for Mouse IgG.
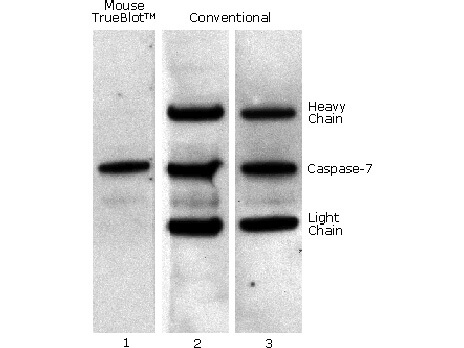
Mouse TrueBlotR IP / Western Blot: Caspase 7 was immunoprecipitated from 0.5 ml of 1x10e7 Jurkat cells/ml with 5 ug mouse anti-human Caspase 7. Precipitate from 1x10e6 cells was subjected to electrophoresis, transferred to an PVDF membrane, and Western blotted with anti-Caspase 7 using Mouse TrueBlotR ULTRA: Anti-Mouse Ig HRP (Lane 1) or conventional HRP-conjugated anti-mouse antibody (Lane 2) - note the detection of the heavy and light chains of the immunoprecipitating antibody in Lane 2 but not in Lane 1. When Lane 1 is re-immunoblotted using conventional HRP-conjugated anti-mouse polyclonal antibody (Lane 3), the heavy and light chains are now detected, confirming that although the immunoprecipitating heavy and light chains are present, Mouse TrueBlotR ULTRA: Anti-Mouse Ig HRP detects only native antibody and not denatured heavy and light chains.
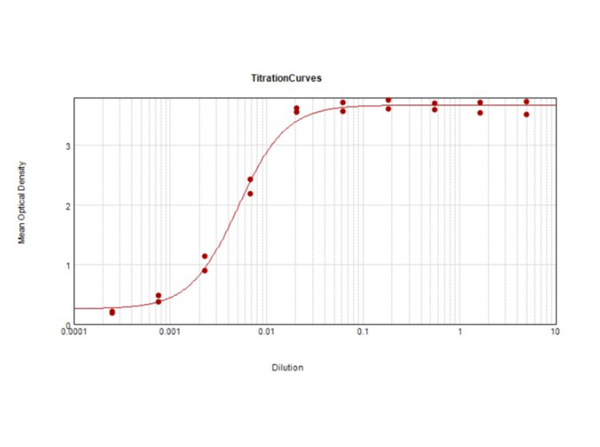
ELISA Results of Mouse TrueBlotR ULTRA: Anti-Mouse Ig HRP. Each well was coated in duplicate with 1.0 μg of Mouse TrueBlotR ULTRA: Anti-Mouse Ig HRP (red line). The starting dilution of antibody was 5μg/ml and the X-axis represents the Log10 of a 3-fold dilution. The titer is 199,000. This titration is a 4-parameter curve fit where the IC50 is defined as the titer of the antibody. Assay performed using TMB-1000 substrate.
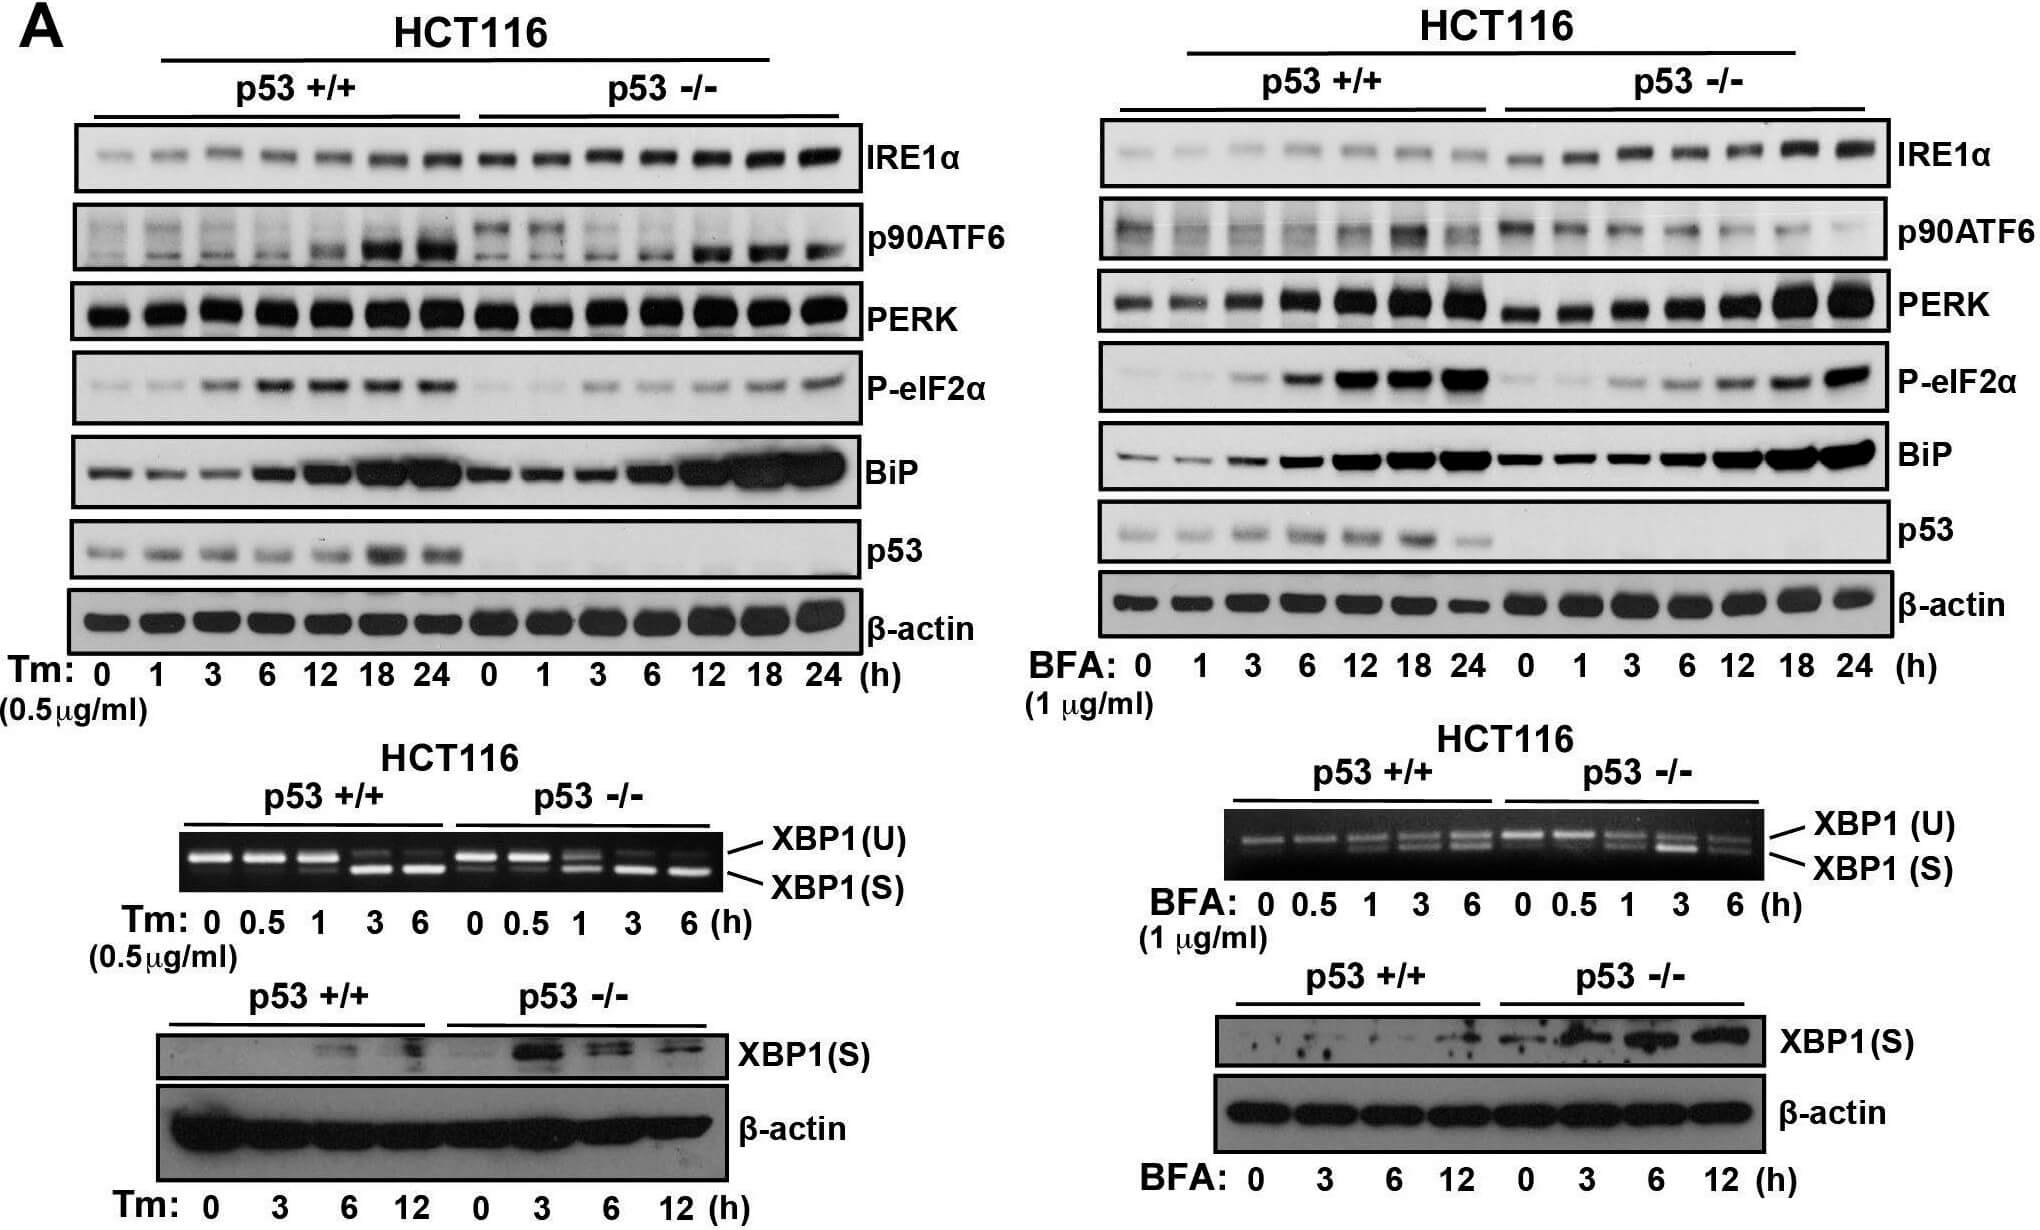
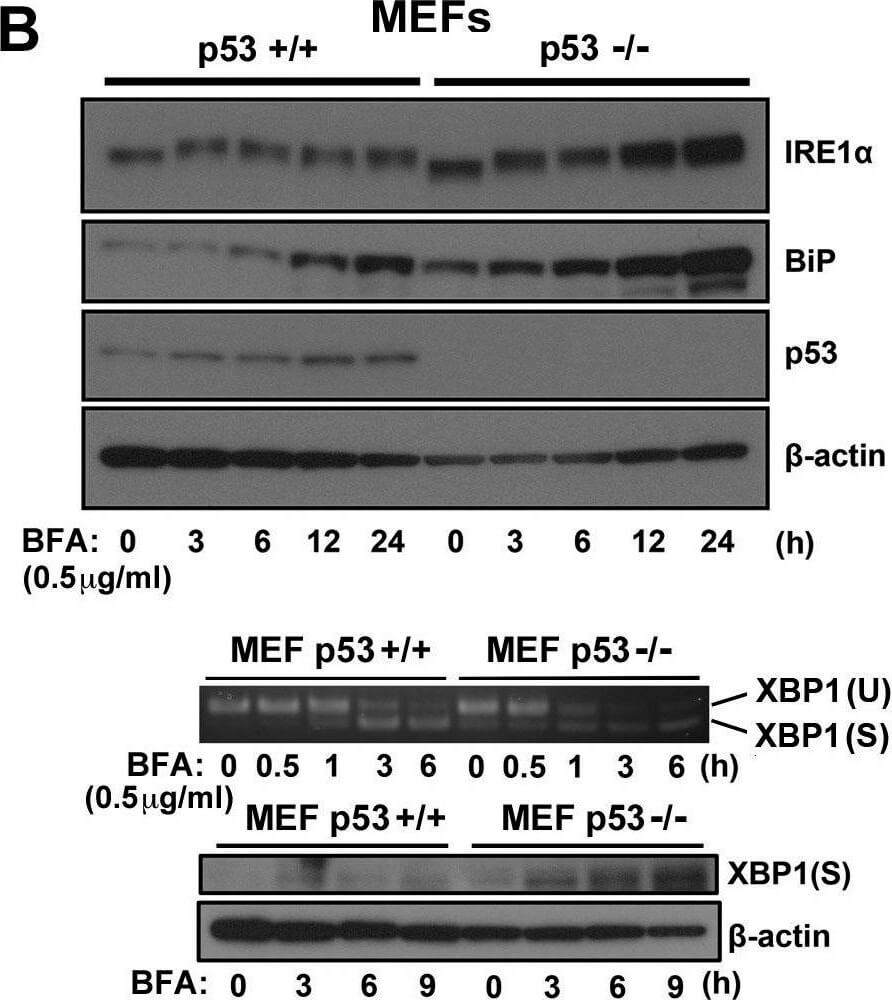
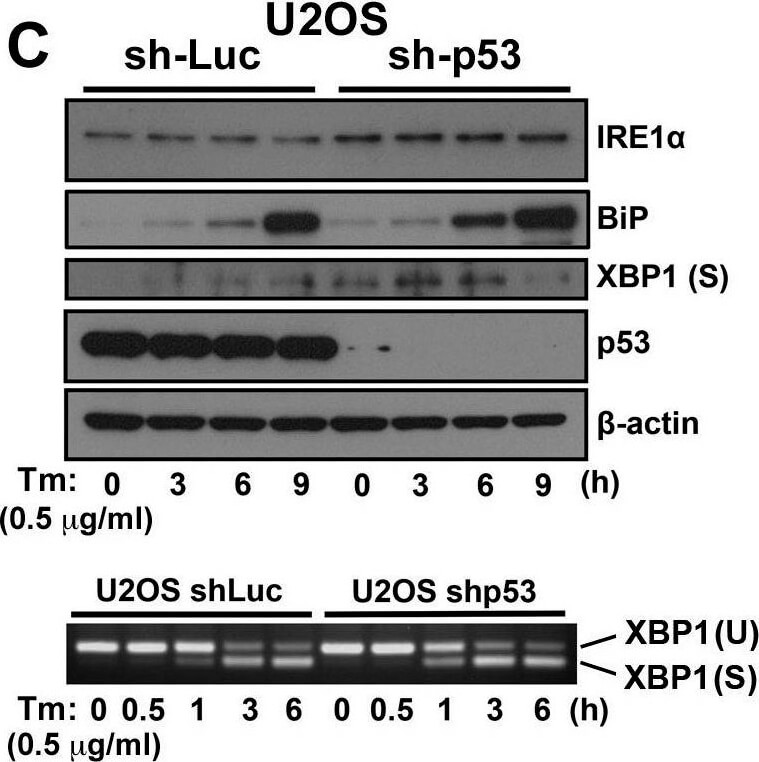
ER stress response in p53-deficient or knockdown cells. A.) HCT116 p53+/+ or HCT116 p53−/− cells, B. MEF p53+/+ or MEF p53−/− cells, and C. U2OS shLuc or U2OS shp53 cells were incubated with Tm (0.5 μg/mL) or BFA (1 μg/mL) for the times indicated. Cell lysates were analyzed using western blotting with the indicated antibodies. The blot was cut based on the size of proteins or stripped. Total RNAs were extracted and subjected to RT-PCR analysis using specific primer sets for XBP1(U) and XBP1(S). Cell lysates were analyzed using western blotting with indicated antibodies. Figure provided by CiteAb. Source: Oncotarget, PMID: 26254280.
ER stress response in p53-deficient or knockdown cells. A.) HCT116 p53+/+ or HCT116 p53−/− cells, B.) MEF p53+/+ or MEF p53−/− cells, and C.) U2OS shLuc or U2OS shp53 cells were incubated with Tm (0.5 μg/mL) or BFA (1 μg/mL) for the times indicated. Cell lysates were analyzed using western blotting with the indicated antibodies. The blot was cut based on the size of proteins or stripped. Total RNAs were extracted and subjected to RT-PCR analysis using specific primer sets for XBP1(U) and XBP1(S). Cell lysates were analyzed using western blotting with indicated antibodies. Figure provided by CiteAb. Source: Oncotarget, PMID: 26254280.
ER stress response in p53-deficient or knockdown cells. A.) HCT116 p53+/+ or HCT116 p53−/− cells, B. MEF p53+/+ or MEF p53−/− cells, and C. U2OS shLuc or U2OS shp53 cells were incubated with Tm (0.5 μg/mL) or BFA (1 μg/mL) for the times indicated. Cell lysates were analyzed using western blotting with the indicated antibodies. The blot was cut based on the size of proteins or stripped. Total RNAs were extracted and subjected to RT-PCR analysis using specific primer sets for XBP1(U) and XBP1(S). Cell lysates were analyzed using western blotting with indicated antibodies. Figure provided by CiteAb. Source: Oncotarget, PMID: 26254280.
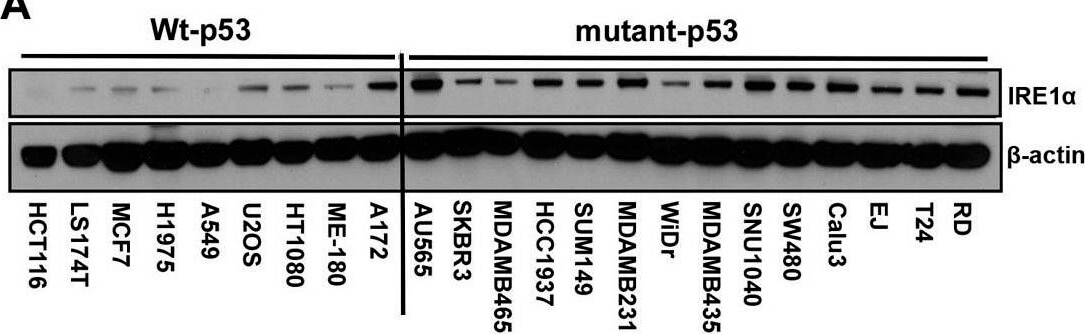
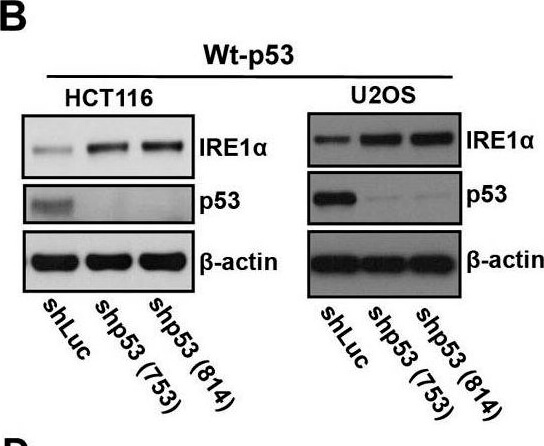
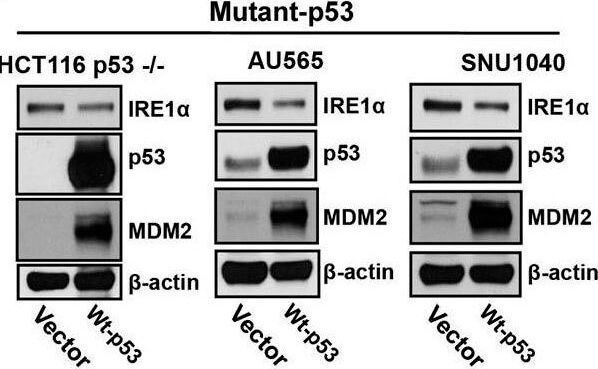
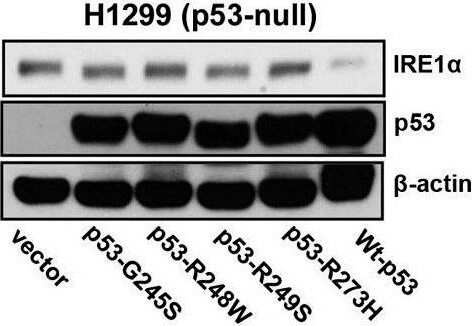
IRE1α expression is regulated by p53. A.) Western blot analysis of the expression of endogenous IRE1α in 23 human cancer cell lines. Cell lines were grouped according to expression of wild-type or mutant p53 as indicated. (A well between wt-p53 and mutant-p53 cell lines was cut, from the gel as indicated by a black line, due to the controversial p53 status of the cell line). Right panel: The intensities of the IRE1α bands (left panel) are expressed relative to those of β-actin. Values shown are the mean ± standard deviation (s.d.). The P value was calculated using two-way ANOVA. B.) Downregulation of p53 expression induces increased expression of IRE1α. HCT116 p53+/+ and U2OS cells were transfected with shLuc, shp53 (753), or shp53 (814), and selected using puromycin. Whole cell lysates of a pool of transfectants were analyzed using western blotting with the indicated antibodies. C.) Overexpression of wild-type p53 inhibits IRE1α expression in mutant-p53 cell lines. Cell lysates, prepared 48 h after transfection with wild-type p53, were analyzed for the expression of indicated proteins. D.) Mutant p53 proteins do not inhibit IRE1α expression. Cell lysates were prepared from cells transfected with p53-G245S, p53-R248W, p53-249S, and p53-R273H expression vectors or from cells that constitutively expressed wild-type p53 and were analyzed for the expression of the indicated proteins. Figure provided by CiteAb. Source: Oncotarget, PMID: 26254280.
IRE1α expression is regulated by p53. A.) Western blot analysis of the expression of endogenous IRE1α in 23 human cancer cell lines. Cell lines were grouped according to expression of wild-type or mutant p53 as indicated. (A well between wt-p53 and mutant-p53 cell lines was cut, from the gel as indicated by a black line, due to the controversial p53 status of the cell line). Right panel: The intensities of the IRE1α bands (left panel) are expressed relative to those of β-actin. Values shown are the mean ± standard deviation (s.d.). The P value was calculated using two-way ANOVA. B.) Downregulation of p53 expression induces increased expression of IRE1α. HCT116 p53+/+ and U2OS cells were transfected with shLuc, shp53 (753), or shp53 (814), and selected using puromycin. Whole cell lysates of a pool of transfectants were analyzed using western blotting with the indicated antibodies. C.) Overexpression of wild-type p53 inhibits IRE1α expression in mutant-p53 cell lines. Cell lysates, prepared 48 h after transfection with wild-type p53, were analyzed for the expression of indicated proteins. D.) Mutant p53 proteins do not inhibit IRE1α expression. Cell lysates were prepared from cells transfected with p53-G245S, p53-R248W, p53-249S, and p53-R273H expression vectors or from cells that constitutively expressed wild-type p53 and were analyzed for the expression of the indicated proteins. Figure provided by CiteAb. Source: Oncotarget, PMID: 26254280.
IRE1α expression is regulated by p53. A.) Western blot analysis of the expression of endogenous IRE1α in 23 human cancer cell lines. Cell lines were grouped according to expression of wild-type or mutant p53 as indicated. (A well between wt-p53 and mutant-p53 cell lines was cut, from the gel as indicated by a black line, due to the controversial p53 status of the cell line). Right panel: The intensities of the IRE1α bands (left panel) are expressed relative to those of β-actin. Values shown are the mean ± standard deviation (s.d.). The P value was calculated using two-way ANOVA. B.) Downregulation of p53 expression induces increased expression of IRE1α. HCT116 p53+/+ and U2OS cells were transfected with shLuc, shp53 (753), or shp53 (814), and selected using puromycin. Whole cell lysates of a pool of transfectants were analyzed using western blotting with the indicated antibodies. C.) Overexpression of wild-type p53 inhibits IRE1α expression in mutant-p53 cell lines. Cell lysates, prepared 48 h after transfection with wild-type p53, were analyzed for the expression of indicated proteins. D.) Mutant p53 proteins do not inhibit IRE1α expression. Cell lysates were prepared from cells transfected with p53-G245S, p53-R248W, p53-249S, and p53-R273H expression vectors or from cells that constitutively expressed wild-type p53 and were analyzed for the expression of the indicated proteins. Figure provided by CiteAb. Source: Oncotarget, PMID: 26254280.
IRE1α expression is regulated by p53. A.) Western blot analysis of the expression of endogenous IRE1α in 23 human cancer cell lines. Cell lines were grouped according to expression of wild-type or mutant p53 as indicated. (A well between wt-p53 and mutant-p53 cell lines was cut, from the gel as indicated by a black line, due to the controversial p53 status of the cell line). Right panel: The intensities of the IRE1α bands (left panel) are expressed relative to those of β-actin. Values shown are the mean ± standard deviation (s.d.). The P value was calculated using two-way ANOVA. B.) Downregulation of p53 expression induces increased expression of IRE1α. HCT116 p53+/+ and U2OS cells were transfected with shLuc, shp53 (753), or shp53 (814), and selected using puromycin. Whole cell lysates of a pool of transfectants were analyzed using western blotting with the indicated antibodies. C.) Overexpression of wild-type p53 inhibits IRE1α expression in mutant-p53 cell lines. Cell lysates, prepared 48 h after transfection with wild-type p53, were analyzed for the expression of indicated proteins. D.) Mutant p53 proteins do not inhibit IRE1α expression. Cell lysates were prepared from cells transfected with p53-G245S, p53-R248W, p53-249S, and p53-R273H expression vectors or from cells that constitutively expressed wild-type p53 and were analyzed for the expression of the indicated proteins. Figure provided by CiteAb. Source: Oncotarget, PMID: 26254280.
|
|
|
|
Western Blot of Mouse TrueBlotR ULTRA: Anti-Mouse Ig HRP. Lane 1: Mouse IgG, non-denatured. Center Lane: 5 μL Opal Pre-stained Ladder (p/n MB210-0500). Lane 2: Mouse IgG, denatured. Load: 50 ng. Primary antibody: none. Secondary antibody: Mouse TrueBlotR ULTRA: Anti-Mouse Ig HRP at 1:1,000 for 60 min at RT. Block: MB-070 for 30 min at RT. Predicted/Observed size: >160 kDa non-denatured for Mouse IgG.
|
|
| 別品名 |
Anti-Mouse IgG HRP, TrueBlot, HRP TrueBlot ULTRA, Peroxidase TrueBlot, TrueBlot for IP/WB, TrueBlot for immunoprecipitation, TrueBlot for western blotting
|
| 交差種 |
Mouse
|
| 適用 |
Western Blot
Enzyme Linked Immunosorbent Assay
Immunoprecipitation
|
| 免疫動物 |
Rat
|
| クローン |
eB144
|
| 標識物 |
Horseradish Peroxidase
|
| 精製度 |
Affinity Purified
|
| 構成内容 |
ミニゲルで約8ブロット分の試薬が含まれます。
|
| 参考文献 |
[Pub Med ID]22492230
|
| [注意事項] |
濃度はロットによって異なる可能性があります。メーカーDS及びCoAからご確認ください。
|
|
| メーカー |
品番 |
包装 |
|
RKL
|
18-8817-30
|
20 UL
|
※表示価格について
|