|
※サムネイル画像をクリックすると拡大画像が表示されます。
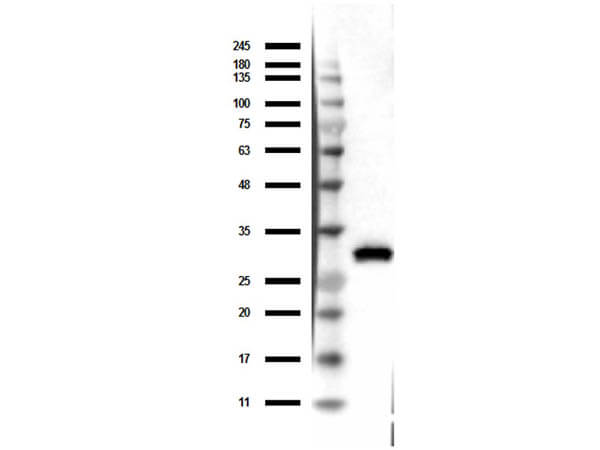
Western Blot of Mouse Anti-RFP Antibody. Lane 1: Opal Prestain Molecular weight (p/n MB-210-0500). Lane 2: 50ng of RFP. Primary Antibody: Mouse Anti-RFP at 1μg/mL overnight at 2-8°C. Secondary Antibody: Rabbit Anti-Mouse HRP (p/n 610-403-C46) at 1:40,000 for 30mins at RT. Block: BlockOut Universal blocking buffer (p/n MB-073). Expect ~27kDa.
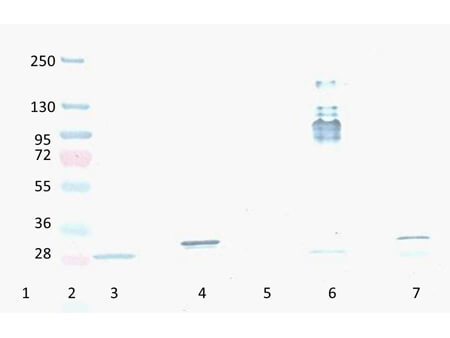
Western Blot of Mouse Anti-RFP antibody. Lane 1: YFP protein. Lane 2: Prestained Molecular Weight Marker. Lane 3: Reduced RFP control Protein. Lane 4: Reduced mCherry. Lane 5: GFP protein. Lane 6: Non-Reduced RFP control Protein. Lane 7: Non-Reduced mCherry. Load: 300ng per lane. Primary antibody: RFP antibody at 1:2000 in MB-070 for 3 hours at RT. Secondary antibody: HRP anti-Mouse secondary antibody at 1:10,000 in MB-070 for 60 min at RT. Substrate: TMBM-100 for 20 min. Predicted/Observed size: ~27 kDa.
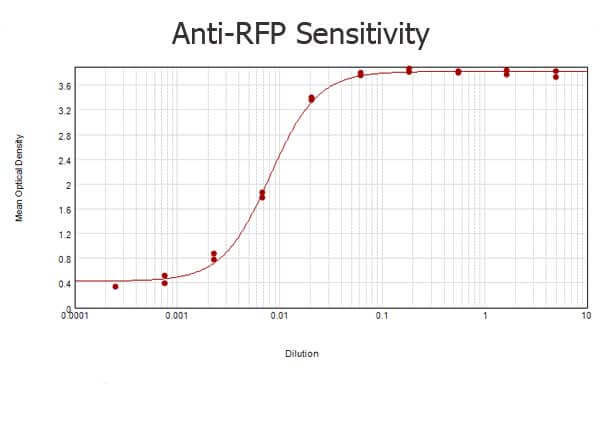
ELISA results of purified Mouse anti-RFP Monoclonal Antibody tested against RFP (p/n 000-001-379). Each well was coated in duplicate with 1.0 μg of the antigen. The starting dilution of antibody was 5μg/ml and the X-axis represents the Log10 of a 3-fold dilution. This titration is a 4-parameter curve fit where the IC50 is defined as the titer of the antibody. Assay performed using 3% fish gel, anti-Mouse IgG Antibody Peroxidase Conjugated Secondary and TMB ELISA Peroxidase Substrate (p/n TMBE-1000).
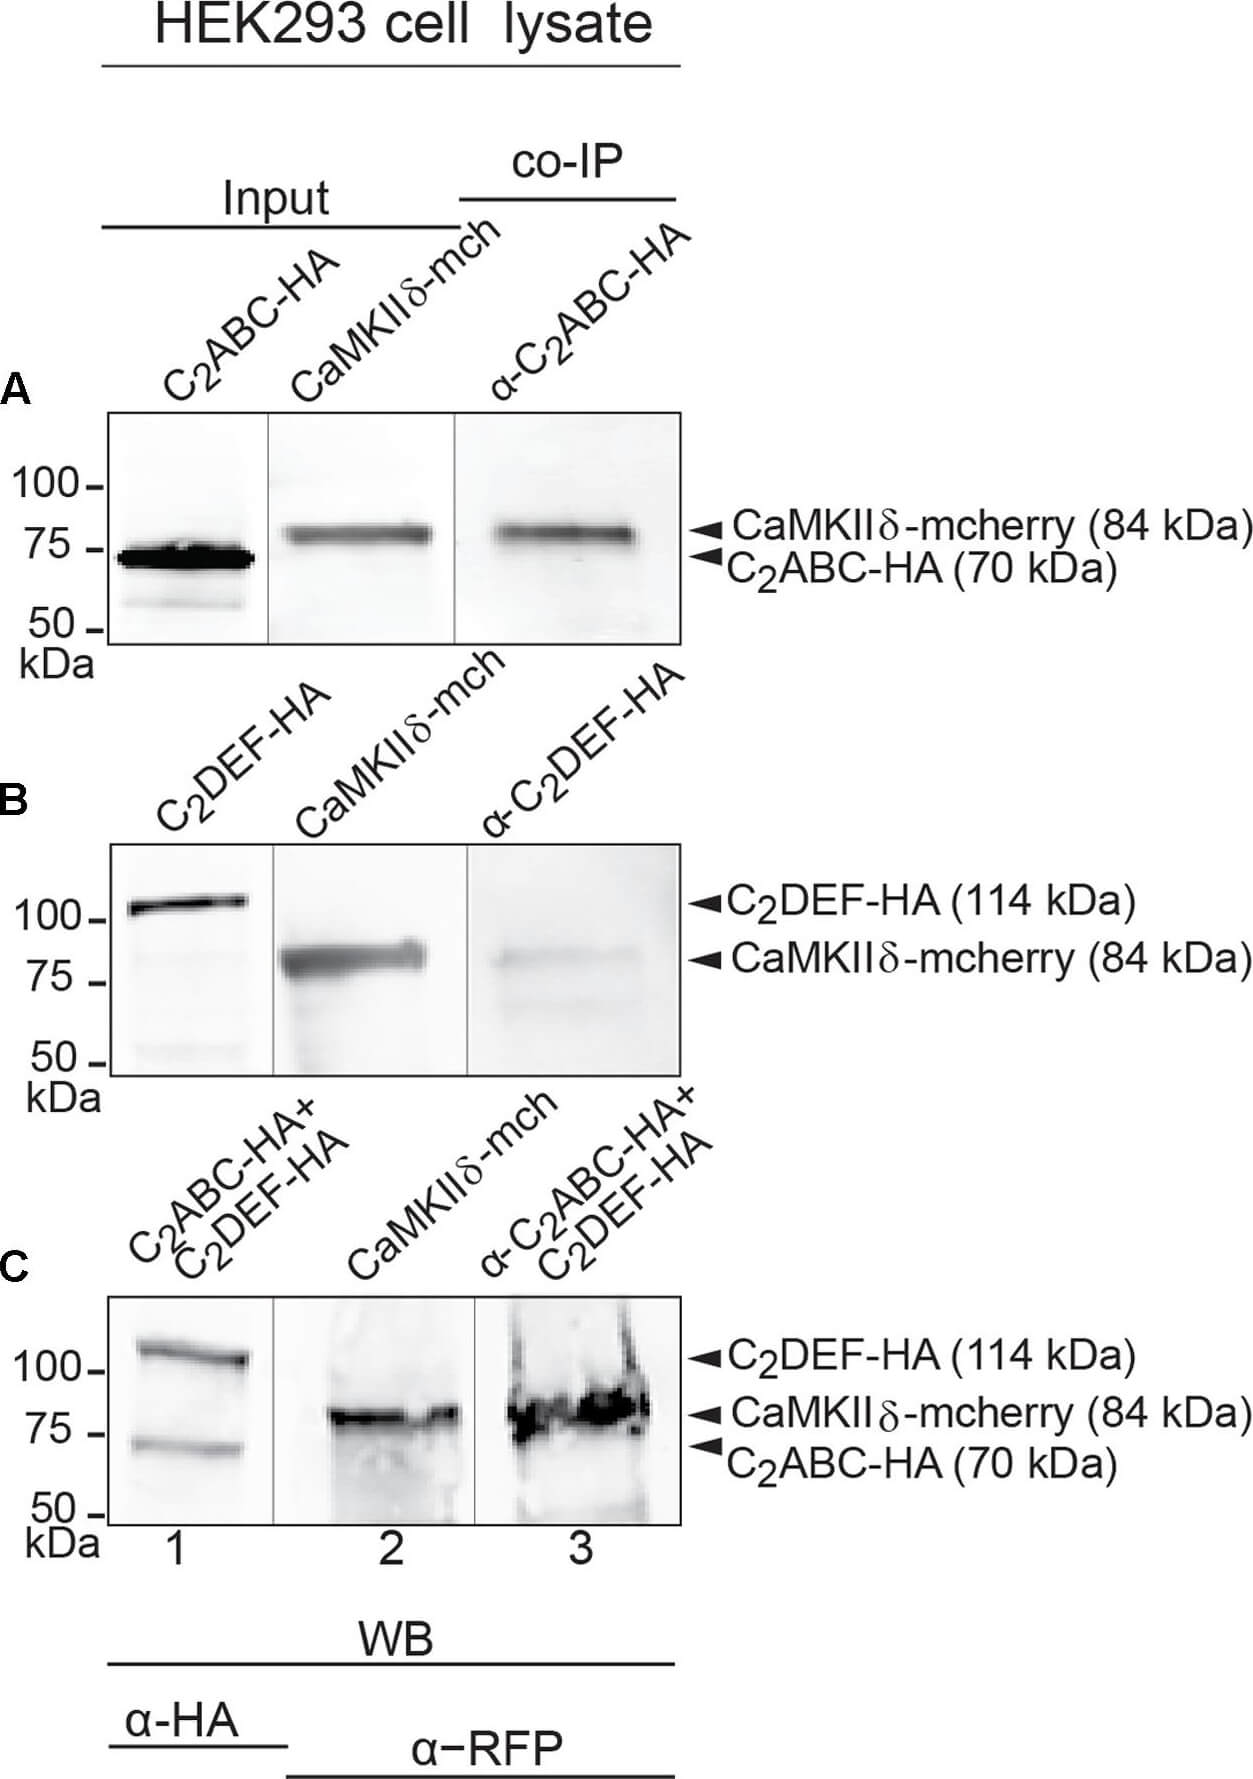
Immunoprecipitation and western blot show interaction of otoferlin with CaMKIIδ. (A?C) Two HA-tagged mouse otoferlin fragments, C2ABC (aa 1?632 in NP_001093865; 70 kDa) and C2DEF (aa 933?1920; 114 kDa) were co-transfected with mcherry-tagged mouse CaMKIIδ into HEK293 cells. Transfections were performed either with otoferlin C2ABC and CaMKIIδ (A, Input Lane 1 and 2), otoferlin C2DEF and CaMKIIδ (B, Input Lane 1 and 2) or in the presence of both C2ABC and C2DEF fragments and CaMKIIδ (C, Input Lane 1 and 2). Co-immunoprecipitations of C2ABC-HA and C2DEF-HA were conducted from HEK293 cell lysates using anti-HA antibodies. CaMKIIδ-mcherry was detected in the eluate using an anti-RFP (red fluorescent protein) antibody (A?C, Lane 3), indicating that CaMKIIδ co-precipitated with recombinant otoferlin fragments. Figure provided by CiteAb. Source: Front Synaptic Neurosci, PMID: 29046633.
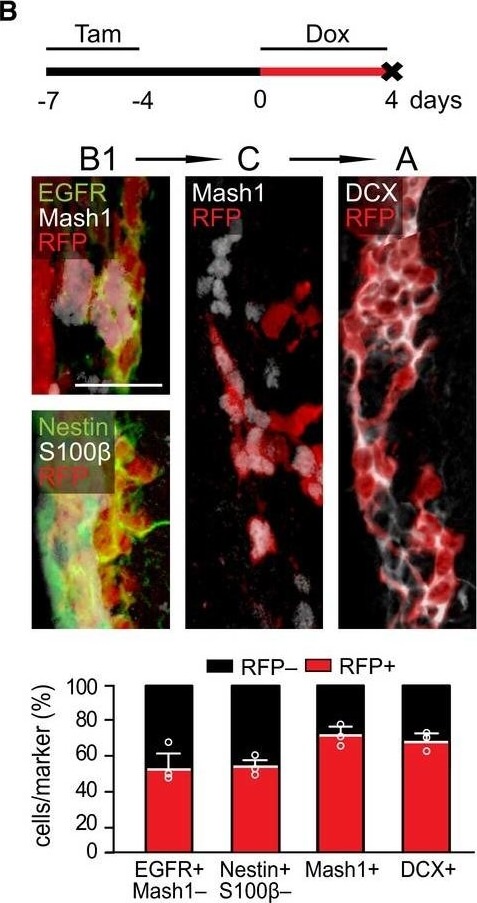
Transgenic model and effects of acute 4D overexpression on NSC and progenitors of the SVZDrawings of the nestinCreERT2 (Imayoshi et?al, 2008), ROSA26rtTA‐flox (Belteki et?al, 2005), and tet4D‐RFP (Nonaka‐Kinoshita et?al, 2013) alleles of the 4D line.From top to bottom: experimental design of 4D induction, fluorescence pictures of the SVZ of a 4D+ mouse and quantification of the proportion of RFP− (black) and RFP+ (red) progenitors among B1, C, and A cells identified with markers as indicated.From top to bottom: experimental design, fluorescence pictures of the SVZ of a 4D− (left) and 4D+ (right and insets magnified) mice, and quantification of the proportion of BrdU+ among B1, C, and A cells (identified as in B). Note that in 4D+ mice quantification was restricted to the RFP+ subpopulation (red bars).Quantification of the absolute number of B1, C, and A cells (identified as in B) in the SVZ of 4D− (white) and 4D+ (black) mice regardless of RFP expression (RFP+/−).Data information: (B?D) Mean?±?SEM; *P?<?0.05 and **P?<?0.01 calculated by unpaired Student's t‐test; N?=?3 mice, n?>?423 cells for each quantification. Scale bar?=?50?μm (B and C) or 20?μm (inset in C). Figure provided by CiteAb. Source: EMBO J, PMID: 30643018.
Transgenic model and effects of acute 4D overexpression on NSC and progenitors of the SVZDrawings of the nestinCreERT2 (Imayoshi et?al, 2008), ROSA26rtTA‐flox (Belteki et?al, 2005), and tet4D‐RFP (Nonaka‐Kinoshita et?al, 2013) alleles of the 4D line.From top to bottom: experimental design of 4D induction, fluorescence pictures of the SVZ of a 4D+ mouse and quantification of the proportion of RFP− (black) and RFP+ (red) progenitors among B1, C, and A cells identified with markers as indicated.From top to bottom: experimental design, fluorescence pictures of the SVZ of a 4D− (left) and 4D+ (right and insets magnified) mice, and quantification of the proportion of BrdU+ among B1, C, and A cells (identified as in B). Note that in 4D+ mice quantification was restricted to the RFP+ subpopulation (red bars).Quantification of the absolute number of B1, C, and A cells (identified as in B) in the SVZ of 4D− (white) and 4D+ (black) mice regardless of RFP expression (RFP+/−).Data information: (B?D) Mean?±?SEM; *P?<?0.05 and **P?<?0.01 calculated by unpaired Student's t‐test; N?=?3 mice, n?>?423 cells for each quantification. Scale bar?=?50?μm (B and C) or 20?μm (inset in C). Figure provided by CiteAb. Source: EMBO J, PMID: 30643018.
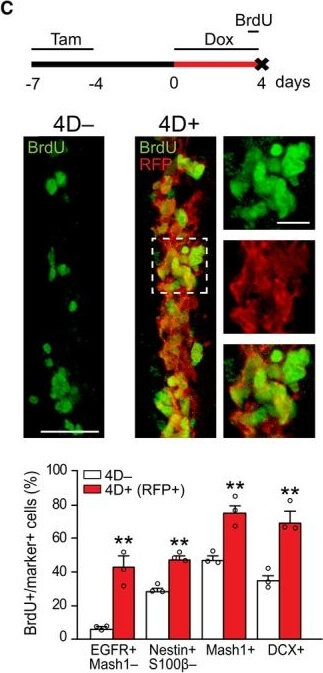
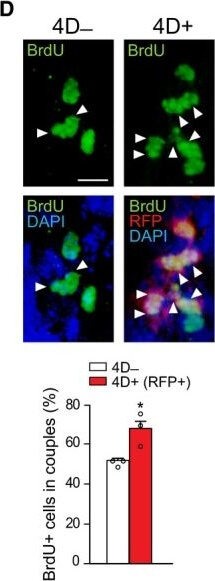
Chronic effect of 4D overexpression on NSC and OB neurogenesisAExperimental design used to assess the chronic effect of a transient 4D induction with BrdU and EdU given during Dox administration or 1?h before sacrifice, respectively.B?EFrom top to bottom: fluorescence pictures of the SVZ (B?D) or OB (E) and absolute number (B, C, and E) or proportions (C?E) of cells in 4D− (white bars) or 4D+ (black or red bars for all or RFP+ cells, respectively) mice scored positive for various markers as indicated. Insets in (C) are magnified (right) with arrowheads pointing label‐retaining NSC (white) or astrocytes (empty). Arrowheads in (D) point cell doublets (among RFP+ protein‐retaining cells in 4D+). (E) GL, glomerular; EPL, external plexiform; MCL, mitral cell and GCL, granule cell layers.Data information: (B?E) Mean?±?SEM; *P?<?0.05, **P?<?0.01 assessed by unpaired Student's t‐test (bar graphs) or Fisher's exact test (pie graphs); N?=?3 mice, n?>?285 cells for each quantification. Scale bars?=?50?μm (B, C, and E) and 20?μm (D and insets in C). Figure provided by CiteAb. Source: EMBO J, PMID: 30643018.
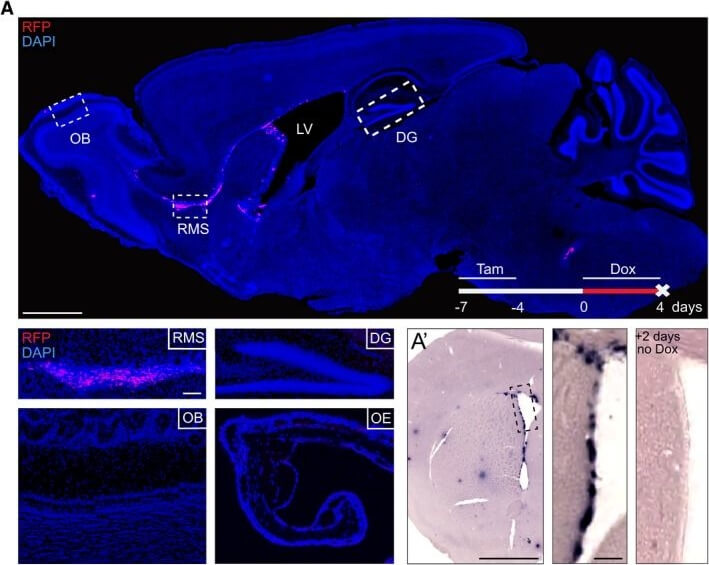
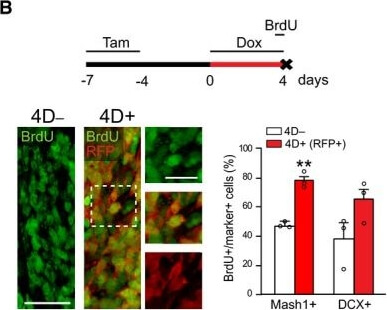
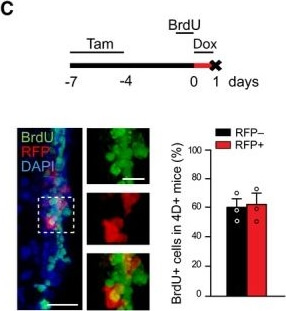
Characterization of the transgenic model and effect of 4D on the RMSA Fluorescence image of a sagittal section of a 4D+ brain after a 4‐day treatment with doxycycline showing RFP signal confined to the SVZ and RMS (nuclei counterstained with DAPI; blue). Insets show representative images of specific brain regions (as indicated) and the olfactory epithelium. A’Phase contrast picture of the SVZ upon in?situ hybridization against mRNA for RFP in a 4D+ brain treated as in (A) and sacrificed immediately after (left) or 2?days after (right) doxycycline administration. (B, C) Experimental design (top), fluorescence pictures (left with magnified insets), and quantifications (right) of BrdU incorporation in the RMS (B) or SVZ (C). (B) shows the proportion of BrdU in C (Mash1+) and A (DCX+) cells in 4D− (white) and 4D+ (red; among RFP+) mice. (C) shows the proportion of RFP− (black) and RFP+ (red) among BrdU+ cells of 4D+ mice. (A) OB, olfactory bulb; RMS, rostral migratory stream; LV, lateral ventricle; DG, dentate gyrus; OE, olfactory epithelium. (A?C) Tam, tamoxifen; Dox, doxycycline. (B, C) Mean?±?SEM; **P?<?0.01; unpaired Student's t‐test; N?=?3 mice and n?>?1,100 cells. Scale bars?=?500 (A top, A’), 100 (insets A and A’), 50 (B and C), and 20 (insets B and C) μm. Figure provided by CiteAb. Source: EMBO J, PMID: 30643018.
Characterization of the transgenic model and effect of 4D on the RMSA Fluorescence image of a sagittal section of a 4D+ brain after a 4‐day treatment with doxycycline showing RFP signal confined to the SVZ and RMS (nuclei counterstained with DAPI; blue). Insets show representative images of specific brain regions (as indicated) and the olfactory epithelium. A’Phase contrast picture of the SVZ upon in?situ hybridization against mRNA for RFP in a 4D+ brain treated as in (A) and sacrificed immediately after (left) or 2?days after (right) doxycycline administration. (B, C) Experimental design (top), fluorescence pictures (left with magnified insets), and quantifications (right) of BrdU incorporation in the RMS (B) or SVZ (C). (B) shows the proportion of BrdU in C (Mash1+) and A (DCX+) cells in 4D− (white) and 4D+ (red; among RFP+) mice. (C) shows the proportion of RFP− (black) and RFP+ (red) among BrdU+ cells of 4D+ mice. (A) OB, olfactory bulb; RMS, rostral migratory stream; LV, lateral ventricle; DG, dentate gyrus; OE, olfactory epithelium. (A?C) Tam, tamoxifen; Dox, doxycycline. (B, C) Mean?±?SEM; **P?<?0.01; unpaired Student's t‐test; N?=?3 mice and n?>?1,100 cells. Scale bars?=?500 (A top, A’), 100 (insets A and A’), 50 (B and C), and 20 (insets B and C) μm. Figure provided by CiteAb. Source: EMBO J, PMID: 30643018.
Characterization of the transgenic model and effect of 4D on the RMSA Fluorescence image of a sagittal section of a 4D+ brain after a 4‐day treatment with doxycycline showing RFP signal confined to the SVZ and RMS (nuclei counterstained with DAPI; blue). Insets show representative images of specific brain regions (as indicated) and the olfactory epithelium. A’Phase contrast picture of the SVZ upon in?situ hybridization against mRNA for RFP in a 4D+ brain treated as in (A) and sacrificed immediately after (left) or 2?days after (right) doxycycline administration. (B, C) Experimental design (top), fluorescence pictures (left with magnified insets), and quantifications (right) of BrdU incorporation in the RMS (B) or SVZ (C). (B) shows the proportion of BrdU in C (Mash1+) and A (DCX+) cells in 4D− (white) and 4D+ (red; among RFP+) mice. (C) shows the proportion of RFP− (black) and RFP+ (red) among BrdU+ cells of 4D+ mice. (A) OB, olfactory bulb; RMS, rostral migratory stream; LV, lateral ventricle; DG, dentate gyrus; OE, olfactory epithelium. (A?C) Tam, tamoxifen; Dox, doxycycline. (B, C) Mean?±?SEM; **P?<?0.01; unpaired Student's t‐test; N?=?3 mice and n?>?1,100 cells. Scale bars?=?500 (A top, A’), 100 (insets A and A’), 50 (B and C), and 20 (insets B and C) μm. Figure provided by CiteAb. Source: EMBO J, PMID: 30643018.
|
|
|
|
Western Blot of Mouse Anti-RFP Antibody. Lane 1: Opal Prestain Molecular weight (p/n MB-210-0500). Lane 2: 50ng of RFP. Primary Antibody: Mouse Anti-RFP at 1μg/mL overnight at 2-8°C. Secondary Antibody: Rabbit Anti-Mouse HRP (p/n 610-403-C46) at 1:40,000 for 30mins at RT. Block: BlockOut Universal blocking buffer (p/n MB-073). Expect ~27kDa.
|
|
| 別品名 |
mouse anti-RFP Antibody, DsRed, rDsRed, Discosoma sp. Red Fluorescent Protein, Red fluorescent protein drFP583
|
| 適用 |
Western Blot
Enzyme Linked Immunosorbent Assay
|
| 免疫動物 |
Mouse
|
| クローン |
8E5.G7
|
| 抗体クラス |
IgG2aκ
|
| 標識物 |
Unlabeled
|
| 精製度 |
Ig fraction - Protein A
|
| Accession No.(Gene/Protein) |
Q9U6Y8
|
| Gene Symbol |
DsRed
|
| Tag情報 |
RFP
|
| 参考文献 |
[Pub Med ID]28334184
|
| [注意事項] |
濃度はロットによって異なる可能性があります。メーカーDS及びCoAからご確認ください。
|
|
| メーカー |
品番 |
包装 |
|
RKL
|
200-301-379
|
100 UG
|
※表示価格について
| 当社在庫 |
なし
|
| 納期目安 |
約10日
|
| 保存温度 |
-20℃
|
|