|
※サムネイル画像をクリックすると拡大画像が表示されます。
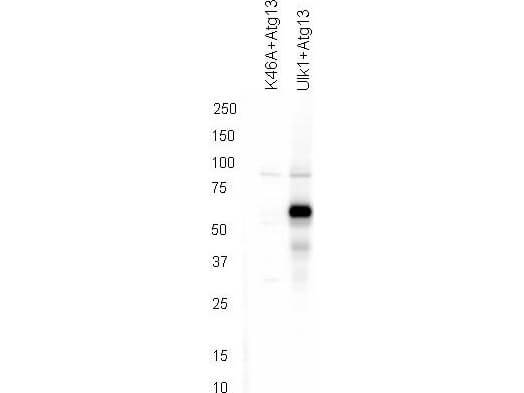
Western blot using Rockland's affinity purified anti-ATG13 pS318 antibody shows detection of phosphorylated ATG13 in 293T cells engineered to coexpress Ulk1 and Atg13 (Ulk1 + Atg13). In the left lane was loaded kinase-dead hypophosphorylated Ulk1-K46A mutant + ATG13. The right lane contains the 293T Ulk1 + ATG13 lysate and shows detection at approximately 57 kDa. The antibody was purified and resolved by SDS-PAGE, then transferred to nitrocellulose membrane. The membrane was blocked with 5% Blotto (p/n B501-0500) and probed with the primary antibody at 1μg/mL overnight at 4°C. After washing, the membrane was probed with Goat Anti-Rabbit HRP secondary 1:5000 in detection buffer (p/n MB-070) for 45 minutes at room temperature. In collaboration with Charles Dorsey at Eli Lilly, Indianapolis, IN and John Cleveland at Scripps, Jupiter, FL.
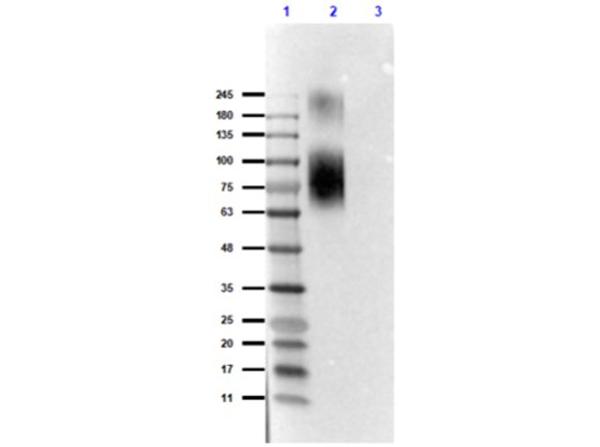
Western Blot of Rabbit Anti-ATG13pS318 Antibody. Lane 1: Opal Prestained Molecular Weight Marker (p/n MB-210-0500). Lane 2: BSA Conjugated ATG13 phospho S318 peptide - reduced [0.2μg]. Lane 3: BSA Conjugated ATG13 non-phospho S318 peptide - reduced [0.2μg]. Primary Antibody: Anti-ATG13pS318 [Rabbit] Antibody at 1.0μg/mL overnight at 2-8°C. Secondary Antibody: Anti-Rabbit IgG [Goat] Peroxidase conjugated (p/n 611-1302) at 1:40,000 for 30mins at RT. Block: Blocking Buffer for Fluorescent Western Blotting (p/n MB-070) for 1hr at RT. Expected: detects the phospho S318 peptide and does not detect the NP-peptide.Exposure: 6.1sec.
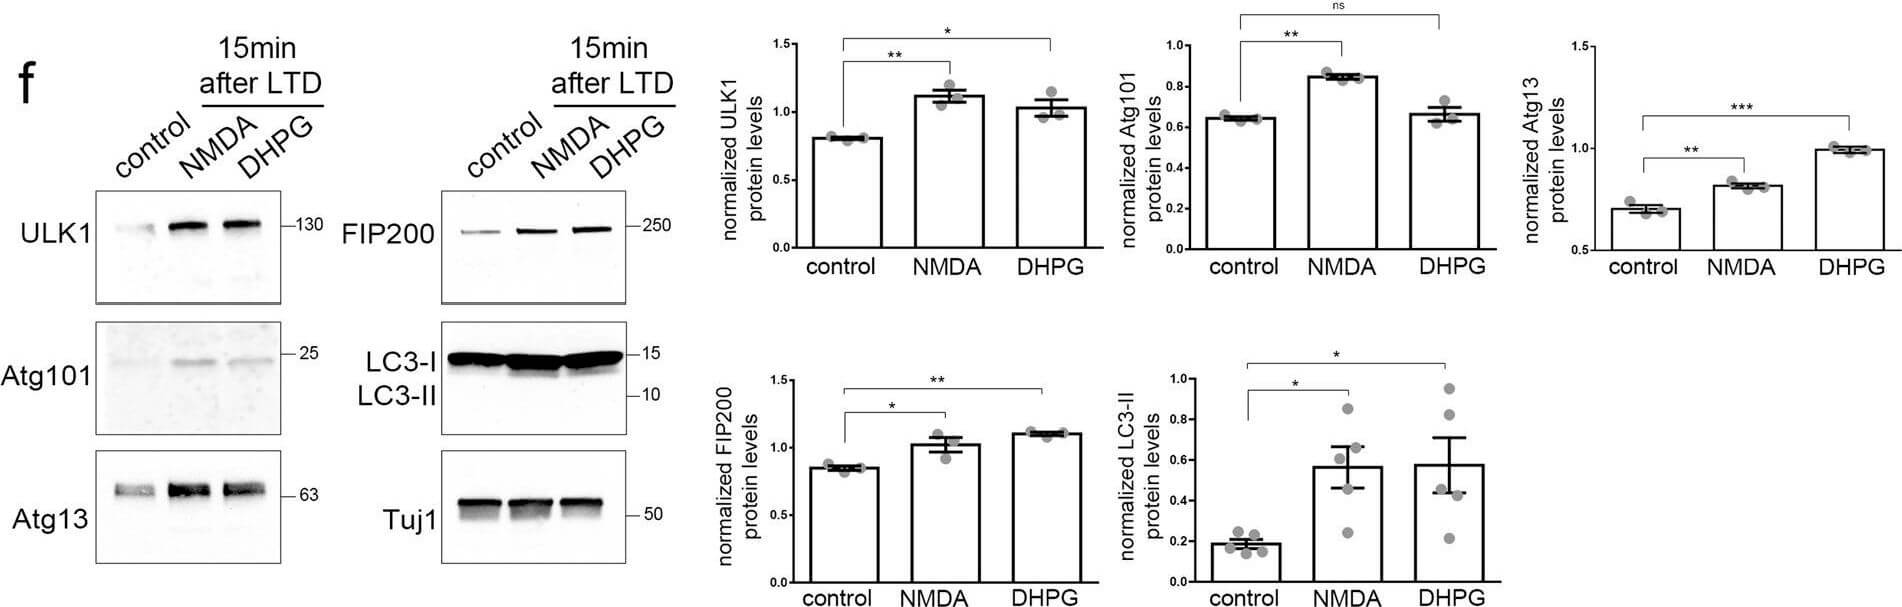
Autophagic vesicles are locally formed in dendrites of cultured neurons following LTD. A) Top, representative super-resolution microscopy dSTORM image of a secondary dendrite labeled with an antibody against LC3, 15?min after cLTD. Bottom, magnification of representative U-shaped LC3-positive structures in dendrites, 15?min after NMDA or DHPG pulses. Scale bars: 2?μm and 250?nm, as indicated. (N?=?3 independent experiments). B) Graph showing the number of LC3-positive U-shaped structures in secondary dendrites visualized in (a), before (control) and 15?min or 60?min after NMDAR- and mGluR-LTD. Bars represent mean values?±?SEM. N?=?3 independent experiments per condition (n?>?9 dendrites per condition). Statistical analysis was performed by one-way ANOVA. For the time point of 15?min?F(2, 33)?=?17.93, p??40 dendrites per condition). D) Confocal images of dendrites immunolabeled with antibodies against WIPI2, LC3, and MAP2 before (control) or after 15?min of NMDAR- and mGluR-LTD. Scale bar: 10?μm. (N?=?6 independent experiments). E) Representative confocal images of neurons immunolabeled with antibodies against ULK1, Atg101, Atg13, FIP200 and, along with MAP2 to label dendrites before (control) or 15?min after LTD-inducing pulses. Scale bar: 20?μm. Graphs showing the number of puncta positive for each ULK1-complex component in secondary dendrites, normalized for dendrite length, in every condition, as indicated. Graph bars represent mean values?±?SEM. N?=?6 independent experiments per condition. Statistical analyses were performed using one-
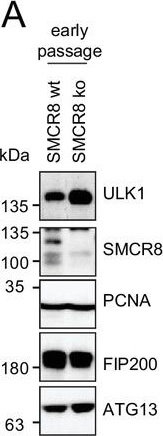
Restored regulation of ULK1 protein levels in SMCR8 knockout cells.(A,B) Early (A) or late (B) passages of HAP1 SMCR8 wildtype (wt) or knockout (ko) cells were subjected to SDS-PAGE and immunoblot with indicated antibodies. PCNA served as loading control. (C) 293T SMCR8 wildtype (wt) or knockout (ko) cells were analyzed as in (A). (D) 293 T cells were transfected with non-targeting control (sicon) or SMCR8 siRNA. Half of the cells were re-transfected every 2?3 days with non-targeting control (sicon) or SMCR8 siRNA while the other half was harvested and subjected to SDS-PAGE and immunoblotting with indicated antibodies. PCNA served as loading control.DOI:http://dx.doi.org/10.7554/eLife.23063.027 Figure provided by CiteAb. Source: Elife, PMID: 28195531.
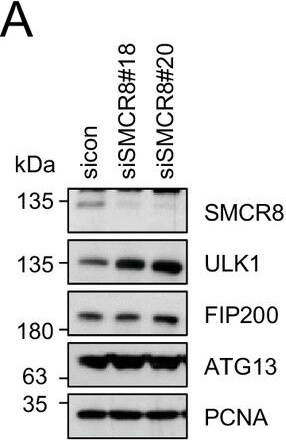
SMCR8 regulates ULK1 gene expression.(A) Lysates from 293 T cells transfected with non-targeting control (sicon) or SMCR8 siRNA were subjected to SDS-PAGE and immunoblotting with indicated antibodies. PCNA served as loading control. (B) Lysates from 293 T cells transfected with non-targeting control (sicon) or SMCR8 siRNA as well as with HA-tagged SMCR8 were subjected to SDS-PAGE and immunoblotting with indicated antibodies. PCNA served as loading control. exp. = exposure. (C) Lysates from 293 T cells transfected with indicated siRNAs and grown in absence (DMSO) or presence of 250 nM Torin1 for 2 hr were lysed and analyzed as in (A). Vinculin served as loading control. (D,E) 293T (D) or U2OS (E) cells were transfected with indicated siRNAs for 72 hr prior to RNA isolation, preparation of cDNA and RT-qPCR with ULK1, FIP200 and SMCR8 specific primers. Error bars represent SEM. Significance was determined using two-way ANOVA compared with sicon. All experiments were performed n?=?3.DOI:http://dx.doi.org/10.7554/eLife.23063.026Restored regulation of ULK1 protein levels in SMCR8 knockout cells.(A,B) Early (A) or late (B) passages of HAP1 SMCR8 wildtype (wt) or knockout (ko) cells were subjected to SDS-PAGE and immunoblot with indicated antibodies. PCNA served as loading control. (C) 293T SMCR8 wildtype (wt) or knockout (ko) cells were analyzed as in (A). (D) 293 T cells were transfected with non-targeting control (sicon) or SMCR8 siRNA. Half of the cells were re-transfected every 2?3 days with non-targeting control (sicon) or SMCR8 siRNA while the other half was harvested and subjected to SDS-PAGE and immunoblotting with indicated antibodies. PCNA served as loading control.DOI:http://dx.doi.org/10.7554/eLife.23063.027 Figure provided by CiteAb. Source: Elife, PMID: 28195531.
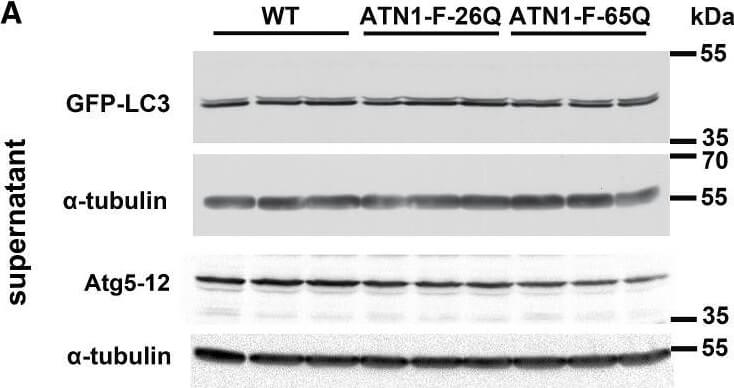
Inhibition of Autophagy Flux at Lysosomal Level and Decrease in Autophagy Initiation Signaling in DRPLA(A?C) The ratio of LC3II to LC3I was used to quantify autophagic flux in western blot analysis of full-length GFP-LC3 in the supernatant fraction of cerebellar lysates at 14?weeks of age (A). The anti-LC3 antibody recognizes a doublet between 35 and 55?kDa (Figure?S4B), consistent with GFP-LC3-I (upper) and cleaved GFP-LC3-II (lower). The level of Atg5-12 conjugate was used to quantify the events of autophagy initiation. Densitometric analysis shows a decreased relative abundance of cleaved GFP-LC3-II to full-length GFP-LC3-I (B) in ATN1-FL-65Q;GFP-LC3 (65Q) mice compared to ATN1-FL-26Q;GFP-LC3 (26Q) and WT;GFP-LC3 (wt) mice. Atg5-12 conjugate (C) is also decreased in ATN1-FL-65Q;GFP-LC3 (65Q) compared to WT;GFP-LC3 (wt). Student’s t test, mean?± SEM, ??p?< 0.01, ?p?< 0.05.(D?F) The accumulation of GFP cleavage product and autophagy receptor p62 was analyzed as a measure of autophagy flux blockage in western blot assay of the cerebellar lysates at 14?weeks of age (D). Mouse anti-GFP antibody recognizes only GFP-LC3-II (Figure?S4B) and cleaved GFP after longer exposure. ?Shorter exposure of anti-GFP signal. Densitometric analysis of the relative abundance of cleaved GFP to GFP-LC3-II (E) as well as the abundance of p62 relative to α-tubulin (F) in WT;GFP-LC3 mice (wt), ATN1-FL-26Q;GFP-LC3 (26Q) and ATN1-FL-65Q;GFP-LC3 (65Q) mice. Student’s t test, mean?± SEM, ?p?< 0.05.(G) Accordingly, western blot analysis of autophagy shows a stall in autophagy flux in end-stage ATN1-FL-65Q mice compared to wild-type (WT) as evidenced by relative decrease of GFP-LC3-II as well as increase of p62 in the pellet fraction. ?Anti-p62 antibody revealed an additional band 20?kDa above the expected band at around ?60?kDa in the supernatant fractions of the cerebellum in end-stage mice.(H) qPCR analysis of Tfeb mRNA levels in the cerebellum of wild-type (wt, white), ATN1-FL-26Q (26Q,
|
|
|
|
Western blot using Rockland's affinity purified anti-ATG13 pS318 antibody shows detection of phosphorylated ATG13 in 293T cells engineered to coexpress Ulk1 and Atg13 (Ulk1 + Atg13). In the left lane was loaded kinase-dead hypophosphorylated Ulk1-K46A mutant + ATG13. The right lane contains the 293T Ulk1 + ATG13 lysate and shows detection at approximately 57 kDa. The antibody was purified and resolved by SDS-PAGE, then transferred to nitrocellulose membrane. The membrane was blocked with 5% Blotto (p/n B501-0500) and probed with the primary antibody at 1μg/mL overnight at 4°C. After washing, the membrane was probed with Goat Anti-Rabbit HRP secondary 1:5000 in detection buffer (p/n MB-070) for 45 minutes at room temperature. In collaboration with Charles Dorsey at Eli Lilly, Indianapolis, IN and John Cleveland at Scripps, Jupiter, FL.
|
|
| 別品名 |
rabbit anti-ATG13 pS318 Antibody, ATG-13, ATG 13, Autophagy-related protein 13, KIAA0652
|
| 交差種 |
Human
|
| 適用 |
Western Blot
Enzyme Linked Immunosorbent Assay
Dot Blot
|
| 免疫動物 |
Rabbit
|
| 標識物 |
Unlabeled
|
| 精製度 |
Affinity Purified
|
| 翻訳後修飾 |
リン酸化
|
| GENE ID |
9776
|
| Accession No.(Gene/Protein) |
NP_001136145.1, O75143
|
| Gene Symbol |
ATG13
|
| 参考文献 |
[Pub Med ID]23524951
|
| [注意事項] |
濃度はロットによって異なる可能性があります。メーカーDS及びCoAからご確認ください。
|
|
| メーカー |
品番 |
包装 |
|
RKL
|
600-401-C49S
|
25 UL
|
※表示価格について
| 当社在庫 |
なし
|
| 納期目安 |
約10日
|
| 保存温度 |
-20℃
|
|