|
※サムネイル画像をクリックすると拡大画像が表示されます。
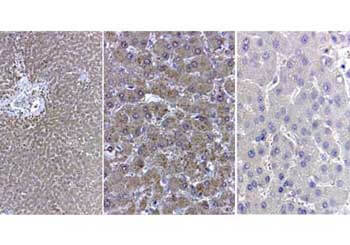
Immunohistochemistry of Catalase antibody. Tissue: human liver. Fixation: formalin fixed paraffin embedded. Antigen retrieval: user optimized. Primary antibody: Catalase antibody 1:400. Secondary antibody: Peroxidase goat anti-rabbit at 1:10,000 for 45 min at RT. Localization: nuclear and occasionally cytoplasmic. Staining: Liver parenchyma: portal triads affected by moderate lymphoplasmacytic inflammation with minimal proliferation of bile ductules. Not obvious interstitial fibrosis. Cytoplasma of hepatocytes, diffuse positivity for the antibody anti-catalase. Neg Ctr (far right) normal rabbit IgG with Human liver. pH 6.2 40X
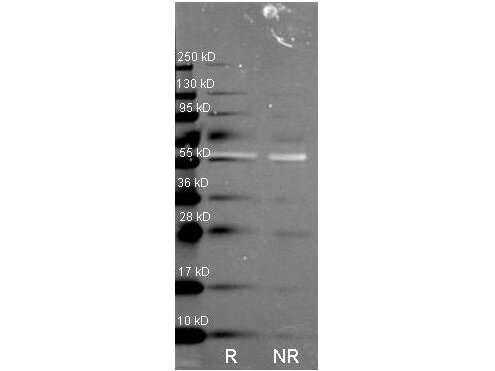
Western Blot of Rabbit anti-Catalase antibody. Lane R: Reduced samples of purified Catalase. Lane NR: Non-reduced samples of purified Catalase. Load: ~1ug of protein per lane. Primary antibody: Catalase antibody at 1:1000 for overnight at 4°C. Secondary antibody: Dylight488TM rabbit secondary antibody at 1:10,000 for 1.5 hrs at RT. Block: MB-070 overnight at 4°C. Predicted/Observed size: 59.9 kDa, 55 kDa for catalase. Other band(s): none.
Immunohistochemical staining of catalase and ED-catalase in mouse kidneys (× 100 original magnification).?Catalase or ED-conjugated catalase was injected into the tail vein of mice at a dose of 1?mg?kg-1. At 30?min after injection, the kidneys were excised and paraffin-embedded sections were immunostained for bovine catalase using biotin-conjugated anti-bovine catalase antibody, followed by incubation with peroxidase-conjugated antibody. (a) Untreated, (b) high-dose catalase (100?mg?kg-1), (c) catalase, and (d) ED-catalase. Figure 1? PMID:?17898699

Antioxidant defense is altered in spinal cords from 6‐week‐old PLP‐tg66/66?mice. Antioxidant enzyme RNA (A) and protein (B) levels were determined in spinal cords from 6‐week‐old WT and PLP‐tg66/66mice (n?=?7/genotype). RNA was quantified by TaqMan real time PCR. Relative protein level is expressed as a percentage of control and referred to γ‐tubulin as loading marker. Glutathione reductase activity is expressed as units/mg tissue. Values are expressed as the mean?±?SD. Student's?t‐test was used for statistical analysis; *P?<?0.05, **P?<?0.01, ***P?<?0.001. Fig 6. PMID:?29027761

Infectious spleen and kidney necrosis virus (ISKNV) infection can induce Nrf2 and antioxidant enzyme expression in GF-1 cells.?(A?C)?Infection of fish cells with ISKNV from day 0 to day 5, showing ISKNV-infected cells?(A), GSH-treated and virus-infected cells?(B), and NAC-treated and virus-infected cells?(C), with the stress transcriptional factor Nrf2 and the antioxidant enzyme catalases Cu/MnSOD and ZnSOD, as determined by western blot analyses. Lanes 1?6 correspond to ISKNV-infected fish cells from day 0 to day 5, while lane 7 shows the MCF7 cell lysate. Membranes were probed with anti-mouse Nrf2, catalase, Cu/MnSOD, and ZnSOD monoclonal antibodies (1:7,500) and an anti-mouse β-actin monoclonal antibody (1:12,500).?(D)?Quantification of protein and Nrf2 expression levels (N?= 3) using the Image J software, from panels?(A?C). All data were analyzed using either paired or unpaired Student’s?t-tests, as appropriate. *P?< 0.01 and **P?< 0.05. FIGURE 3.PMID:?36304944

Vegetative pole of uncultured granulosa explants. (A) α-Connexin-43 immunostaining of F1; most cells have gap junctions. (B) α-connexin-43 immunostaining of F3; few cells with gap junctions. (C) α-Catalase immunostaining of F1; weak catalase immunofluorescence signal. (D) α-Catalase immunostaining of F3; strong catalase immunofluorescence signal. Bars = 10 μm. Fig 5. PMID:?10639483

α-Catalase immunostaining (red label) (A) Double staining with α-connexin-43 (green label) of the F1 vegetative pole. Cells with strongly stained peroxisomes show absence of gap junctions, whereas cells with low catalase staining show many gap junctions. (B) F1 transition zone 24-hr cultured while attached to the animal pole; weak catalase signal. (C) F1 transition zone 24-hr cultured in absence of the animal pole; increase in catalase signal is observed. (D) Transition zone (uncultured); large isolated cell with strong catalase signal. (E) Uncultured F1 granulosa showing randomly dispersed granules. (F) F1 granulosa after 24-hr culturing, showing accumulation of peroxisomes in the vicinity of lipid droplets (seen as black holes at the periphery of the cells). (G) F1 granulosa 24-hr cultured without gap junction blocking agents. (H) F1 granulosa 24-hr cultured in presence of AGA (200 μM); stronger α-catalase signal in comparison with?G. (I) F1 granulosa 24-hr cultured in presence of octanol (250 μM); stronger α-catalase signal in comparison with?G.?Bars = 10 μm. Fig 6. PMID:?10639483

Effects of LH and/or OP on the amounts (C) CATA expressions. The cells were treated with LH (10 ng/ml) alone or in combination with OP (100 μM) for 24 h. mRNA data are the mean ± SEM of four separate experiments each performed in duplicate and are expressed relative to the amount of GAPDH mRNA. Protein data are the mean ± SEM of four experiments each performed with separate cell preparations and are expressed relative to the amount of beta-actin protein. Different letters indicate significant differences (P<0.05), as determined by ANOVA followed by a Fisher's PLSD as a multiple comparison test. Fig 1. PMID:?23386101

Antioxidant defense is altered in spinal cords from 6‐week‐old PLP‐tg66/66?mice. Antioxidant enzyme RNA (A) and protein (B) levels and GR activity (C) were determined in spinal cords from 6‐week‐old WT and PLP‐tg66/66mice (n?=?7/genotype). RNA was quantified by TaqMan real time PCR. Relative protein level is expressed as a percentage of control, and referred to γ‐tubulin as loading marker. Glutathione reductase activity is expressed as units/mg tissue. Values are expressed as the mean?±?SD. Student's?t‐test was used for statistical analysis; *P?<?0.05, **P?<?0.01, ***P?<?0.001. Fig 6. PMID:?29027761

MG intake increases ovarian expression of SIRT1 and proteins of SIRT1 network.?Western blot analysis of SIRT1 (a), SIRT3 (b), PGC1α (c), mtTFA (d), CAT (e) and SOD2 (f) and representative images of immunoreactive bands (g) are shown. Data are presented as means?±?SEM of densitometric analysis of immunoreactive bands normalized to internal reference protein (β-actin). Three mice per experimental group were employed. Experiments were done in triplicate. ***P?<?0.001, **P?<?0.01, *P?<?0.05,?t-test. Fig 5. PMID:?30771486

|
|
|
|
Immunohistochemistry of Catalase antibody. Tissue: human liver. Fixation: formalin fixed paraffin embedded. Antigen retrieval: user optimized. Primary antibody: Catalase antibody 1:400. Secondary antibody: Peroxidase goat anti-rabbit at 1:10,000 for 45 min at RT. Localization: nuclear and occasionally cytoplasmic. Staining: Liver parenchyma: portal triads affected by moderate lymphoplasmacytic inflammation with minimal proliferation of bile ductules. Not obvious interstitial fibrosis. Cytoplasma of hepatocytes, diffuse positivity for the antibody anti-catalase. Neg Ctr (far right) normal rabbit IgG with Human liver. pH 6.2 40X
|
|
| 別品名 |
rabbit anti-Catalase Antibody, Cas 1 antibody, CAT antibody, Cs1 antibody, MGC138422 antibody, MGC138424 antibody
|
| 別包装 |
あり
|
| 由来詳細 |
Liver
|
| 交差種 |
Human
Mouse
Rat
Bovine
Sheep
|
| 適用 |
Western Blot
Immunohistochemistry
|
| 免疫動物 |
Rabbit
|
| 標識物 |
Unlabeled
|
| 精製度 |
Ig fraction - Ion Exchange /Gel Filtration
|
| GENE ID |
531682
|
| Accession No.(Gene/Protein) |
AAI03067.1, P00432
|
| Gene Symbol |
CAT
|
| 参考文献 |
[[Cosmo Reference Collection]][Pub Med ID]36304944,36672696,32266253,17898699,19072199,29027761,21144579,33659749,42548869
|
| [注意事項] |
濃度はロットによって異なる可能性があります。メーカーDS及びCoAからご確認ください。
|
|
| メーカー |
品番 |
包装 |
|
RKL
|
200-401-051S
|
25 UL
|
※表示価格について
| 当社在庫 |
なし
|
| 納期目安 |
約10日
|
| 保存温度 |
-20℃
|
|


