

| 別品名 |
DsRed, rDsRed, Discosoma sp. Red Fluorescent Protein, Red fluorescent protein drFP583
|
| 標識物 |
Unlabeled
|
| 適用 |
Western Blot
Enzyme Linked Immunosorbent Assay
|
| 免疫動物 |
Chicken
|
| 交差種 |
Tomato
|
| Accession No.(Gene/Protein) |
Q9U6Y8
|
| Gene Symbol |
DsRed
|
| Tag情報 |
RFP
|
| 形状 |
滅菌済み液状品
|
| その他 |
[関連商品]000-001-379, 003-0202, 600-901-379S, 603-103-126, 603-103-002
|
| 参考文献 |
[Pub Med ID]31974446, 25629932, 27427984, 27527793, 27731315, 28498105, 28506464, 29891732, 30154505, 30451684, 28942923, 31493814, 32243809, 32541005, 32562755, 32634398, 33221554, 30282023, 28817806, 29489752+他多数
|
| [注意事項] |
濃度はロットによって異なる可能性があります。メーカーDS及びCoAからご確認ください。
|
|
※サムネイル画像をクリックすると拡大画像が表示されます。
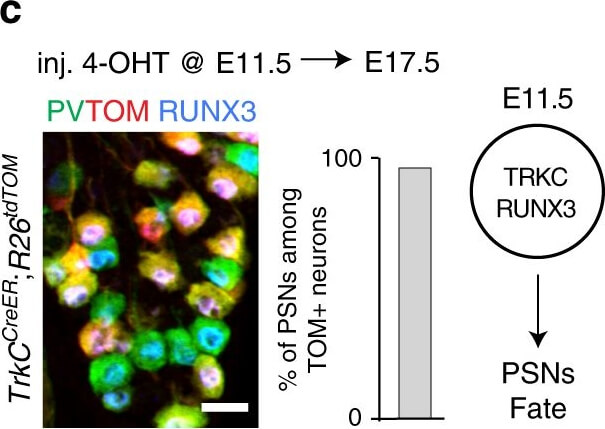
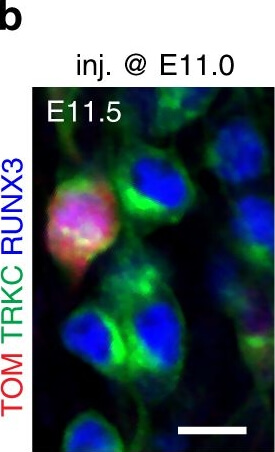
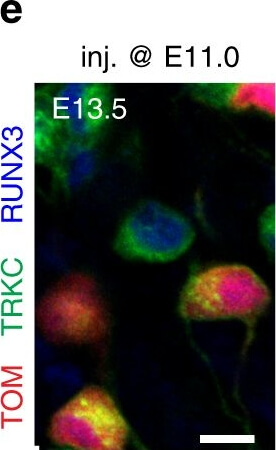
Differential expression of TRKC in PSNs prior to the cell death period. a Scheme of our working hypothesis. b, c Temporal fate mapping of TRKC PSNs by 4 OHT induction. TrkCCreER mice allow temporary activation of CreER in the TRKC+ cells 2?h after 4 OHT injection21,22. Immunostaining for PV, RFP and RUNX3 on E17.5 DRG sections (c) and graph showing distribution of PV+/RUNX3+ PSNs among the TOM+ cells (n?=?4). Scale bar: 20?μm. d Quantification of PSNs at C5 and C7. ***P?<?0.001, one way analysis of variance (ANOVA) with Sidaks multiple comparisons test (n?=?23). The window of PSNs cell death is shown. e TRKC expression in E11.5 ISL1+ (and RUNX3+, whose staining is not shown for more visibility) DRG neurons. Scale bar: 50?μm. f TRKC levels in PSNs of e?illustrated by color coding; dark blue indicates the lower and red the higher TRKC levels. From here, all observations are done at brachial levels (C58). g Distribution of TRKC levels in PSNs from e. h Distribution of TRKC levels in PSNs in E11.5 DRG neurons (from g). The data exhibit a Poisson like distribution (one representative animal), with the mean used to define the two different categories of TRKC intensity (TRKCHigh and TRKCLow). i Projection of seven images of RUNX3+/TRKC+ PSNs from one brachial DRG; dots indicate TRKC labeled neurons and color codes reveal TRKC intensity as shown in h. j Projection image of smFISH for pan Ntrk3 and Ntrk3 full length (FL) transcripts in E11.5 DRG, visualized at high magnification in (1) and (2) (images show full projection); right panel shows color coding of Ntrk3 FL levels in red; the brighter, the higher levels.Source data are available as a Source Data file Figure provided by CiteAb. Source: Nat Commun, PMID: 31515492.
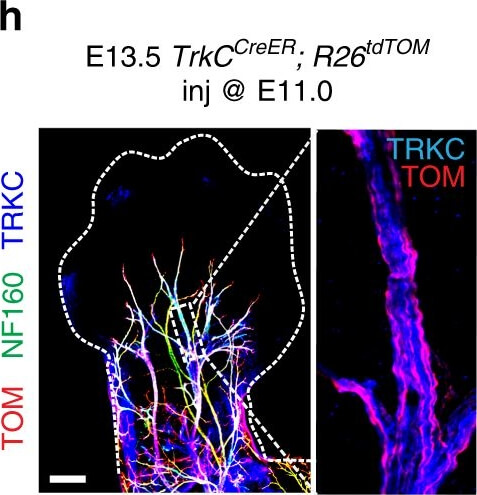
PSNs with high TRKC levels preferentially survive the cell death period. a Temporal fate mapping of TRKCHigh PSNs by 4-OHT (low dose, 0.02?g/kg). bd Injection of TrkCCreER;R26tdTOM mice with low dose of 4-OHT at E11.0; DRG analyzed at E11.5 with recombination in few (b), preferentially high TRKC PSNs (c, d) (P?<?0.001). Frequency distribution of TOM+ PSNs according to TRKC intensity (c) and pie charts (d) illustrating the large proportion of TOM+ cells among TRKCHigh PSNs. Scale bar: 50?μm. e, f Percentage of recombined PSNs at E11.5 and E13.5 in DRGs from TrkCCreER;R26tdTOM animals after 4-OHT injection at E11.0 (*P?<?0.05, Students t-test; n?=?2 litters with 6 embryos, E11.5; 2 litters with 5 embryos, E13.5). g The percentage of labeled PSNs does not change between E11.5 and E13.5 in R26CreERT2;R26tdTOM embryos injected at E11.0 with 0.032?g/kg 4-OHT (n?=?4). Similarly, the recombination rate in TOM+ PSNs does not change between E14.5 and E16.5 in TrkCCreER;R26tdTOM embryos after injection at E14.0 with 0.02?g/kg 4-OHT (n?=?2). Unpaired Students t-test. h Whole-mount immunostaining for TRKC, NF160 and RFP of E13.5 forelimb from TrkCCreER;R26tdTOM embryos injected with low dose 4-OHT at E11.0. Insert shows restricted number of TOM+ fibers dispersed amongst TRKC+ axons. Scale bar: 200?μm. i Pattern and color-coded depth (in micrometers) of innervation of TRKC+, NF160+ and RFP+ nerve fibers (processed from h) of E13.5 forelimb from TrkCCreER;R26tdTOM embryos injected with a low dose of 4-OHT (0.02?g/kg) at E11. The pattern and depth color code reveal similar territories (in all dimensions, xyz) of innervation of the TOM+ PSNs compared to all axons (NF160). Scale bar: 200?μm. j Scheme illustrating the preferential selection of TRKCHigh PSNs during the cell death period. Source data are available as a Source Data file Figure provided by CiteAb. Source: Nat Commun, PMID: 31515492.
PSNs with high TRKC levels preferentially survive the cell death period. a Temporal fate mapping of TRKCHigh PSNs by 4-OHT (low dose, 0.02?g/kg). bd Injection of TrkCCreER;R26tdTOM mice with low dose of 4-OHT at E11.0; DRG analyzed at E11.5 with recombination in few (b), preferentially high TRKC PSNs (c, d) (P?<?0.001). Frequency distribution of TOM+ PSNs according to TRKC intensity (c) and pie charts (d) illustrating the large proportion of TOM+ cells among TRKCHigh PSNs. Scale bar: 50?μm. e, f Percentage of recombined PSNs at E11.5 and E13.5 in DRGs from TrkCCreER;R26tdTOM animals after 4-OHT injection at E11.0 (*P?<?0.05, Students t-test; n?=?2 litters with 6 embryos, E11.5; 2 litters with 5 embryos, E13.5). g The percentage of labeled PSNs does not change between E11.5 and E13.5 in R26CreERT2;R26tdTOM embryos injected at E11.0 with 0.032?g/kg 4-OHT (n?=?4). Similarly, the recombination rate in TOM+ PSNs does not change between E14.5 and E16.5 in TrkCCreER;R26tdTOM embryos after injection at E14.0 with 0.02?g/kg 4-OHT (n?=?2). Unpaired Students t-test. h Whole-mount immunostaining for TRKC, NF160 and RFP of E13.5 forelimb from TrkCCreER;R26tdTOM embryos injected with low dose 4-OHT at E11.0. Insert shows restricted number of TOM+ fibers dispersed amongst TRKC+ axons. Scale bar: 200?μm. i Pattern and color-coded depth (in micrometers) of innervation of TRKC+, NF160+ and RFP+ nerve fibers (processed from h) of E13.5 forelimb from TrkCCreER;R26tdTOM embryos injected with a low dose of 4-OHT (0.02?g/kg) at E11. The pattern and depth color code reveal similar territories (in all dimensions, xyz) of innervation of the TOM+ PSNs compared to all axons (NF160). Scale bar: 200?μm. j Scheme illustrating the preferential selection of TRKCHigh PSNs during the cell death period. Source data are available as a Source Data file Figure provided by CiteAb. Source: Nat Commun, PMID: 31515492.
PSNs with high TRKC levels preferentially survive the cell death period. a Temporal fate mapping of TRKCHigh PSNs by 4-OHT (low dose, 0.02?g/kg). bd Injection of TrkCCreER;R26tdTOM mice with low dose of 4-OHT at E11.0; DRG analyzed at E11.5 with recombination in few (b), preferentially high TRKC PSNs (c, d) (P?<?0.001). Frequency distribution of TOM+ PSNs according to TRKC intensity (c) and pie charts (d) illustrating the large proportion of TOM+ cells among TRKCHigh PSNs. Scale bar: 50?μm. e, f Percentage of recombined PSNs at E11.5 and E13.5 in DRGs from TrkCCreER;R26tdTOM animals after 4-OHT injection at E11.0 (*P?<?0.05, Students t-test; n?=?2 litters with 6 embryos, E11.5; 2 litters with 5 embryos, E13.5). g The percentage of labeled PSNs does not change between E11.5 and E13.5 in R26CreERT2;R26tdTOM embryos injected at E11.0 with 0.032?g/kg 4-OHT (n?=?4). Similarly, the recombination rate in TOM+ PSNs does not change between E14.5 and E16.5 in TrkCCreER;R26tdTOM embryos after injection at E14.0 with 0.02?g/kg 4-OHT (n?=?2). Unpaired Students t-test. h Whole-mount immunostaining for TRKC, NF160 and RFP of E13.5 forelimb from TrkCCreER;R26tdTOM embryos injected with low dose 4-OHT at E11.0. Insert shows restricted number of TOM+ fibers dispersed amongst TRKC+ axons. Scale bar: 200?μm. i Pattern and color-coded depth (in micrometers) of innervation of TRKC+, NF160+ and RFP+ nerve fibers (processed from h) of E13.5 forelimb from TrkCCreER;R26tdTOM embryos injected with a low dose of 4-OHT (0.02?g/kg) at E11. The pattern and depth color code reveal similar territories (in all dimensions, xyz) of innervation of the TOM+ PSNs compared to all axons (NF160). Scale bar: 200?μm. j Scheme illustrating the preferential selection of TRKCHigh PSNs during the cell death period. Source data are available as a Source Data file Figure provided by CiteAb. Source: Nat Commun, PMID: 31515492.
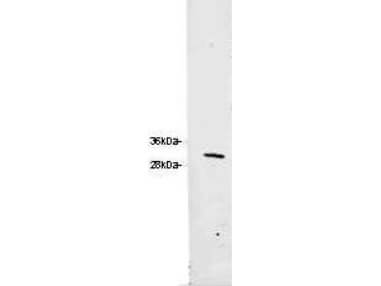
Western blot of Rockland's Chicken Anti-RFP Antibody. Loaded 0.1 ug of RFP protein (p/n 000-001-379) on a 4-20% gel and transferred to nitrocellulose membrane. Chicken anti-RFP Antibody was added at 1.0 ug/mL at RT for 2 hours. IRDye800R goat anti-Chicken (p/n 603-132-126) was added at 1:20,000 at RT for 45 minutes.
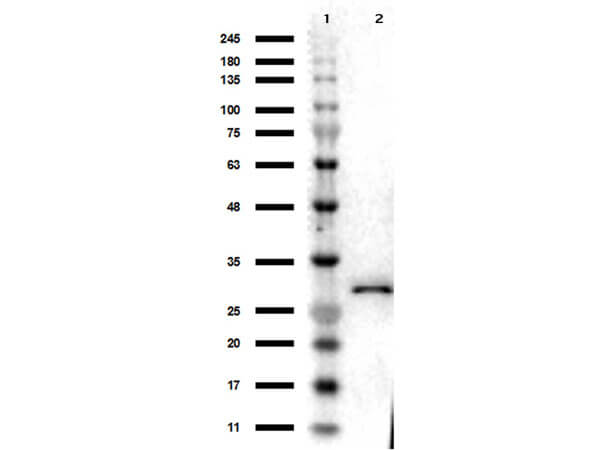
Western Blot Results of Chicken Anti-RFP Antibody. Lane 1: Opal PreStained Molecular Weight Marker (p/n MB-210-0500). Lane 2: RFP (p/n 000-001-379), load 50ng. Primary Antibody: Anti-RFP 1ug/mL overnight at 4C. Secondary Antibody: Goat Anti-Chicken HRP (p/n 603-103-126) at 1:40,000 for 30min at RT. Blocking: BlockOut (p/n MB-073) for 30min at RT. Expect: 27kDa.
|
|
|
|
Differential expression of TRKC in PSNs prior to the cell death period. a Scheme of our working hypothesis. b, c Temporal fate mapping of TRKC PSNs by 4 OHT induction. TrkCCreER mice allow temporary activation of CreER in the TRKC+ cells 2?h after 4 OHT injection21,22. Immunostaining for PV, RFP and RUNX3 on E17.5 DRG sections (c) and graph showing distribution of PV+/RUNX3+ PSNs among the TOM+ cells (n?=?4). Scale bar: 20?μm. d Quantification of PSNs at C5 and C7. ***P?<?0.001, one way analysis of variance (ANOVA) with Sidaks multiple comparisons test (n?=?23). The window of PSNs cell death is shown. e TRKC expression in E11.5 ISL1+ (and RUNX3+, whose staining is not shown for more visibility) DRG neurons. Scale bar: 50?μm. f TRKC levels in PSNs of e?illustrated by color coding; dark blue indicates the lower and red the higher TRKC levels. From here, all observations are done at brachial levels (C58). g Distribution of TRKC levels in PSNs from e. h Distribution of TRKC levels in PSNs in E11.5 DRG neurons (from g). The data exhibit a Poisson like distribution (one representative animal), with the mean used to define the two different categories of TRKC intensity (TRKCHigh and TRKCLow). i Projection of seven images of RUNX3+/TRKC+ PSNs from one brachial DRG; dots indicate TRKC labeled neurons and color codes reveal TRKC intensity as shown in h. j Projection image of smFISH for pan Ntrk3 and Ntrk3 full length (FL) transcripts in E11.5 DRG, visualized at high magnification in (1) and (2) (images show full projection); right panel shows color coding of Ntrk3 FL levels in red; the brighter, the higher levels.Source data are available as a Source Data file Figure provided by CiteAb. Source: Nat Commun, PMID: 31515492.
|
|
|
| メーカー |
品番 |
包装 |
|
RKL
|
600-901-379
|
100 UG
|
※表示価格について
| 当社在庫 |
なし
|
| 納期目安 |
約10日
|
| 保存温度 |
-20℃
|
|