|
※サムネイル画像をクリックすると拡大画像が表示されます。
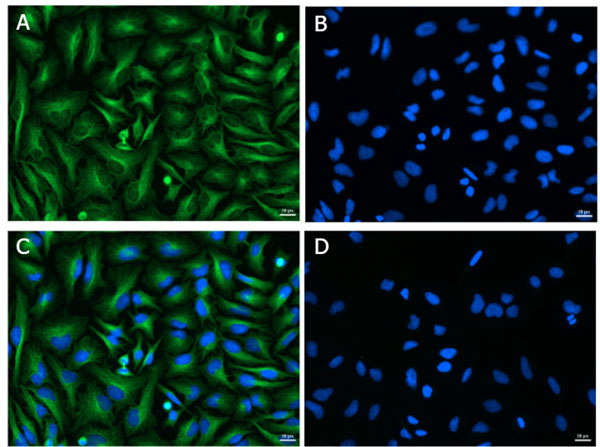
Immunofluorescence of Rabbit Anti-Alpha Tubulin Antibody. Cell line:? HeLa?. Primary Antibody: Alpha Tubulin? (p/n 600-401-880?) at 4.4 μg/mL (1:250) for 1hr at RT?. Secondary Antibody: Goat Anti-Rabbit? DyLight? 488? (p/n 611-141-121) at 1 μg/mL (1:1000) overnight at 4 °C?. Fixative:? Ice Cold Methanol?. Permeabilization: Ice Cold Methanol?. Nuclear stain:? Hoechst 33342?. Expected Localization:? Cytoplasmic?. Image: A) Alpha Tubulin, B)? Nuclear Stain?, C) Merge?, D)? Secondary Only Control?.
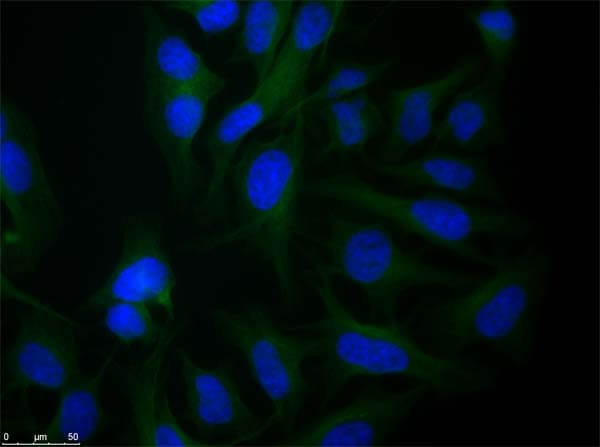
Immunofluorescence microscopy of Rabbit Anti-alpha-Tubulin antibody using HeLa cells fixed with PFA. Anti-alpha-Tubulin Antibody was used at 1 μg/mL, O/N at 4?C. Secondary antibody: Anti-RABBIT IgG DyLight? 488 Conjugated Preadsorbed (p/n 611-741-127) at 2 ug/ml for 1 h at RT. Localization: TUBA1B is the major constituent of microtubules in the cytoplasm. Staining: Tubulin as green fluorescent signal with DAPI (blue) nuclear counterstain.
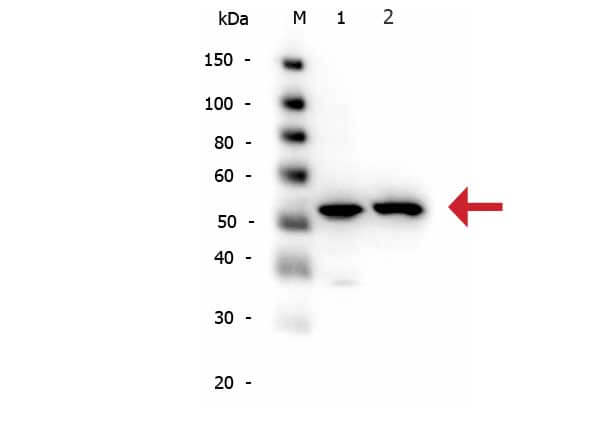
Western Blot of Rabbit anti-alpha-Tubulin antibody. Lane 1: HeLa WCL (p/n W09-000-364). Lane 2: NIH/3T3 WCL (p/n W10-000-358). Load: 10 μg per lane. Primary antibody: alpha-Tubulin antibody at 1:1,000 for overnight at 4°C. Secondary antibody: Peroxidase rabbit secondary antibody (p/n 611-103-122) at 1:40,000 for 30 min at RT. Block: Blocking Buffer for Fluorescent Western Blotting (p/n MB-070) for 30 min at RT. Predicted/Observed size: 50 kDa, 50 kDa for alpha-Tubulin. Other band(s): N/A.
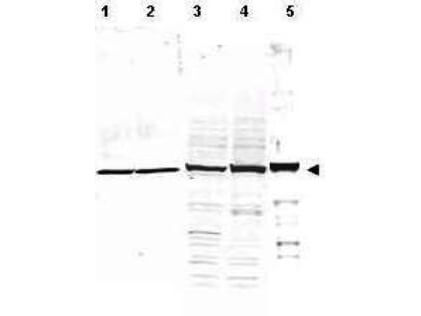
Western Blot of Rabbit Anti-Alpha Tubulin Antibody. Lane 1: whole cell lysates from mouse brain (p/n W10-000-T004). Lane 2: rat brain (p/n W12-000-T077). Lane 3: A431 cells (p/n W09-000-361). Lane 4: Jurkat cells (p/n W09-001-370). Lane 5: HeLa cells (p/n W09-000-364). Load: 35 μg per lane. Primary antibody: Alpha Tubulin antibody at 1:1,200 for overnight at 4°C. Secondary antibody: IRDye800? rabbit secondary antibody at 1:10,000 for 45 min at RT. Block: 5% BLOTTO (p/n B501-0500) overnight at 4°C. Predicted/Observed size: ~50 kDa corresponding to alpha tubulin (arrowhead). Other band(s): none.
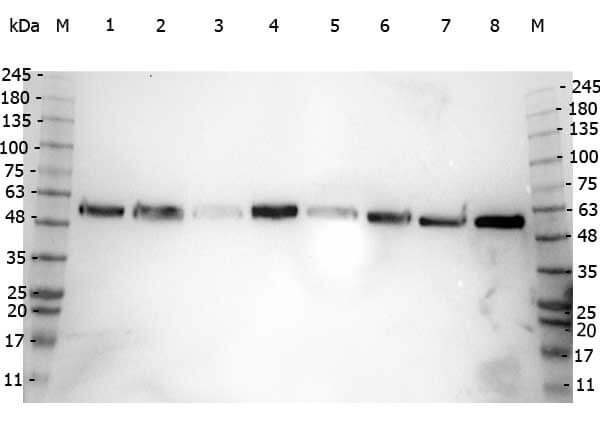
Western Blot of Rabbit anti-Alpha-Tubulin antibody. Marker: Opal Pre-stained ladder (p/n MB-210-0500). Lane 1: HEK293 lysate (p/n W09-000-365). Lane 2: HeLa Lysate (p/n W09-000-364). Lane 3: MCF-7 Lysate (p/n W09-000-360). Lane 4: Jurkat Lysate (p/n W09-000-370). Lane 5: A431 Lysate (p/n W09-000-361). Lane 6: LNCaP Lysate (p/n W09-001-GJ9). Lane 7: A-172 Lysate (p/n W09-001-GL5). Lane 8: NIH/3T3 Lysate (p/n W10-000-358). Load: 35 μg per lane. Primary antibody: Alpha-Tubulin antibody at 1:2,000 for overnight at 4°C. Secondary antibody: Peroxidase rabbit secondary antibody (p/n 611-103-122) at 1:30,000 for 60 min at RT. Blocking Buffer: 1% Casein-TTBS (p/n MB-082) for 30 min at RT. Predicted/Observed size: 50 kDa for Alpha-tubulin.
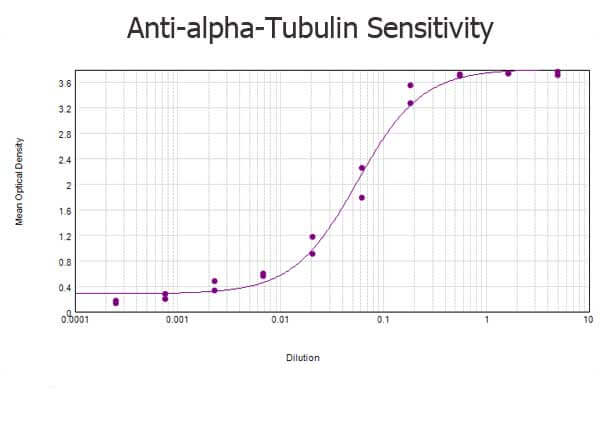
ELISA results of purified Rabbit anti-alpha-Tubulin Antibody tested against BSA-conjugated peptide of immunizing peptide. Each well was coated in duplicate with 0.1μg of conjugate. The starting dilution of antibody was 5μg/ml and the X-axis represents the Log10 of a 3-fold dilution. This titration is a 4-parameter curve fit where the IC50 is defined as the titer of the antibody. Assay performed using 3% fish gel, Goat anti-Rabbit IgG Antibody Peroxidase Conjugated (Min X Bv Ch Gt GP Ham Hs Hu Ms Rt & Sh Serum Proteins) (p/n 611-103-122) and TMB ELISA Peroxidase Substrate (p/n TMBE-1000).
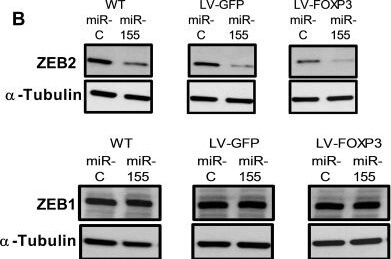
miR-155 and FOXP3 down regulate endogenous ZEB2 in human breast cancer cells resulting in altered levels of EMT markers Vimentin and E-cadherin(A) Relative abundance of ZEB2 and ZEB1 protein in WT, GFP or FOXP3 overexpressing BT549 cells transfected with miR-155 or miR-control. Relative abundance of protein was determined by quantitation of the abundance of ZEB2 or ZEB1 proteins normalised to reference protein α-Tubulin by western blot analysis. Quantitation of bands was carried out using Image J software. Mean + SD plotted. Student’s t test ***P < 0.001. ZEB1 protein expression as above. n = 3 experiments. (B) ZEB2 and ZEB1 protein in WT, GFP or FOXP3 overexpressing BT549 cells transfected with miR-155 or miR-control by western blot. Representative western blot shown. (C) Relative abundance of Vimentin and E-cadherin protein in WT, GFP or FOXP3 overexpressing BT549 cells transfected with miR-155 or miR-control. Relative abundance of protein was determined by quantitating the abundance of E-cadherin or Vimentin proteins and normalising to reference protein β-Actin by western blot analysis. Quantitation of bands was carried out using Image J software. Mean + SD plotted. Student’s t test ***P < 0.001, **P < 0.01. n = 3 experiments. (D) Vimentin and E-cadherin protein in WT, GFP or FOXP3 overexpressing BT549 cells transfected with miR-155 or miR-control analysed by western blot. Representative western blot shown. Figure provided by CiteAb. Source: Oncotarget, PMID: 29963231.
|
|
|
|
Immunofluorescence of Rabbit Anti-Alpha Tubulin Antibody. Cell line:? HeLa?. Primary Antibody: Alpha Tubulin? (p/n 600-401-880?) at 4.4 μg/mL (1:250) for 1hr at RT?. Secondary Antibody: Goat Anti-Rabbit? DyLight? 488? (p/n 611-141-121) at 1 μg/mL (1:1000) overnight at 4 °C?. Fixative:? Ice Cold Methanol?. Permeabilization: Ice Cold Methanol?. Nuclear stain:? Hoechst 33342?. Expected Localization:? Cytoplasmic?. Image: A) Alpha Tubulin, B)? Nuclear Stain?, C) Merge?, D)? Secondary Only Control?.
|
|
| 別品名 |
rabbit anti-alpha-Tubulin Antibody, rabbit anti-α-tubulin antibody, Tubulin alpha-1B chain, Tubulin alpha-ubiquitous chain, Alpha-tubulin ubiquitous, Tubulin K-alpha-1, TUBA1B, tubulin loading control, Alpha-tubulin, Tubulin alpha-1A, TUBA1A, TUBA3, LIS3
|
| 交差種 |
Human
Mouse
Rat
|
| 適用 |
Western Blot
Enzyme Linked Immunosorbent Assay
Immuno Fluorescence
|
| 免疫動物 |
Rabbit
|
| 抗原部位 |
a.a.427-441
|
| 標識物 |
Unlabeled
|
| 精製度 |
Affinity Purified
|
| Accession No.(Gene/Protein) |
17986283, P68363
|
| Gene Symbol |
TUBA1B
|
| 参考文献 |
[Pub Med ID]26352206
|
|
| メーカー |
品番 |
包装 |
|
RKL
|
600-401-880
|
200 UG
|
※表示価格について
| 当社在庫 |
なし
|
| 納期目安 |
約10日
|
| 保存温度 |
-20℃
|
|
※当社では商品情報の適切な管理に努めておりますが、表示される法規制情報は最新でない可能性があります。
また法規制情報の表示が無いものは、必ずしも法規制に非該当であることを示すものではありません。
商品のお届け前に最新の製品法規制情報をお求めの際はこちらへお問い合わせください。
|
※当社取り扱いの試薬・機器製品および受託サービス・創薬支援サービス(納品物、解析データ等)は、研究用としてのみ販売しております。
人や動物の医療用・臨床診断用・食品用としては、使用しないように、十分ご注意ください。
法規制欄に体外診断用医薬品と記載のものは除きます。
|
|
※リンク先での文献等のダウンロードに際しましては、掲載元の規約遵守をお願いします。
|
|
※CAS Registry Numbers have not been verified by CAS and may be inaccurate.
|