|
※サムネイル画像をクリックすると拡大画像が表示されます。
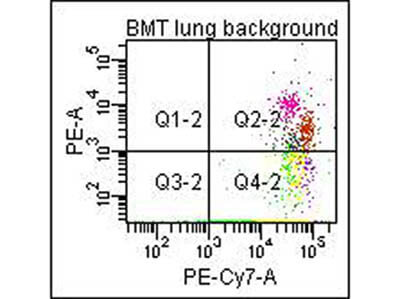
Flow Cytometry of Anti-Collagen Type I Biotin Conjugated Antibody (600-406-103). Showing a 7.4% of fibrocyte population in the mouse lung using CD45 and Col 1A1 double positive markers. In the experiment, we used Biotinated Collagen Type 1 (p/n 600-406-103) in combination with a PE-conjugated secondary antibody for flow cytometric analysis. Courtesy of Walden Ai, PhD, Univ of SC School of Medicine.
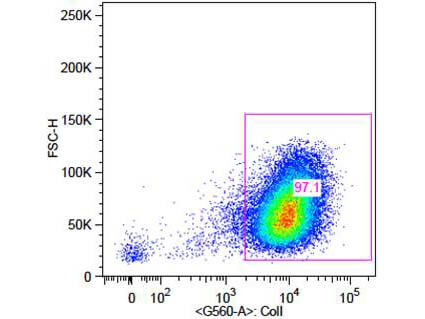
Flow Cytometry of Rabbit Anti-Collagen 1 Antibody. Cells: primary adult human dermal fibroblast cells. Stimulation: none. Primary antibody: Biotin-Conjugated Collagen 1 antibody (600-406-103) at 5μg/mL for 45 min at 4°C. Secondary antibody: Rabbit Streptavidin, R-PE antibody at 1:500 for 15 min at RT. Courtesy of D. Figueroa NIH.
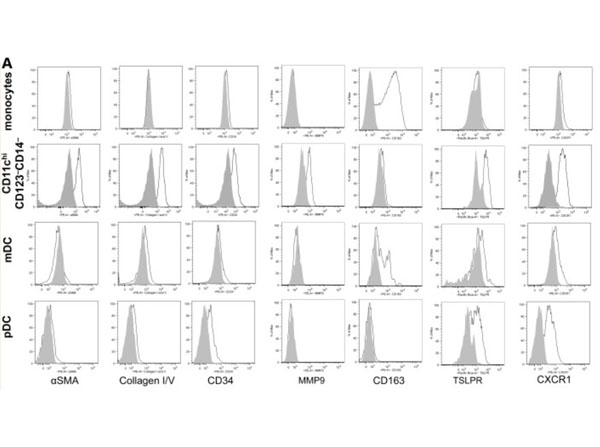
Flow cytometry of Anti-Collagen Type I Antibody Biotin Conjugated.Expanded CD11chiCD123?CD14??cells are fibrocytes that mediate angiogenesis.?(A) Using the same gating strategy as shown in?Figure 1A, CD11chiCD123?CD14??cells from a representative subject sample were analyzed for cell surface phenotype. The shaded areas represent background fluorescence on the designated population as indicated by FMO controls. This is representative of more than 10 experiments.?Figure 2. PMID: 23757729.
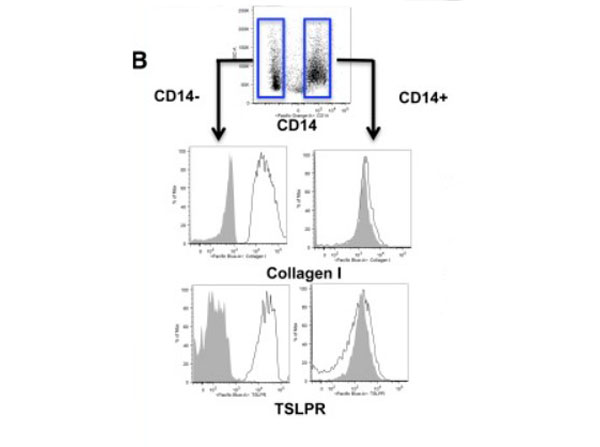
Flow Cytometry of Anti-Collagen Type I Antibody Biotin Conjugated.IL-4 induces monocytes to differentiate into CD14??fibrocytes that are readily distinguished from CD14+?macrophages in the same culture.? (B) Cell surface phenotype of IL-4?differentiated adherent cells identifies 2 subsets based on CD14 expression, which further shows differential expression of collagen and TSLPR. FMO controls on gated CD14+?vs CD14??populations are shown by shaded gray histograms. This is representative of more than 5 experiments from 5 separate healthy donors.?Figure 5. PMID: 23757729.
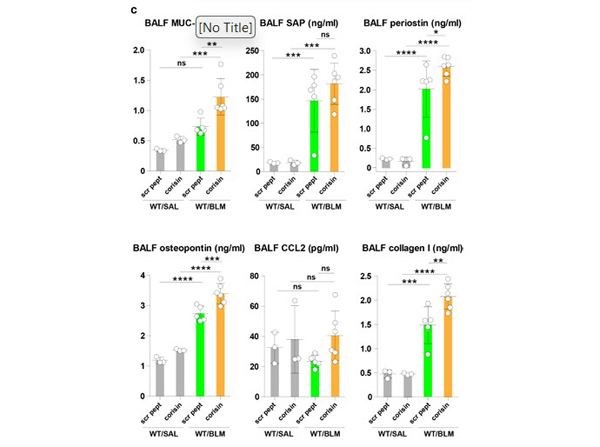
c) The BALF levels of serum amyloid P component (SAP), MUC-1, chemokine (C-C motif) ligand 2 (CCL2), periostin, collagen I, and osteopontin were measured by enzyme immunoassays following the manufacturer’s instructions. The number of mice: n=3 in WT/SAL/scr pept and WT/SAL/corisin groups, n=5 in WT/BLM/scr pept, and n=6 in WT/BLM/corisin group. Data are the mean ± S.D. Statistical analysis by ANOVA with a post hoc Newman-Keuls test. *p<0.05; **p<0.01; ***p<0.001; ****p<0.0001. ns, not significant. SF22. PMID:?35322016
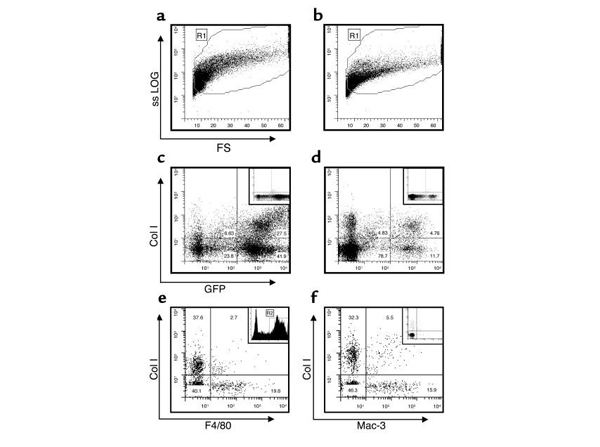
Flow-cytometric analysis of whole-lung cells from GFP BM chimera mice. Whole-lung cells were isolated from BLM-treated (a?and?c) or saline-treated (b?and?d) GFP BM chimera mice at day 21 after BLM or saline treatment. Following the appropriate immunostaining, the cells were analyzed by flow cytometry for GFP and Col I expression (c?and?d) after gating on intact live cells (region indicated by R1) according to side scatter (shown in logarithmic scale, ssLOG) and forward scatter (FS) (a?and?b). Results of analysis of cells treated with isotype-matched control IgG for the anti?Col I antibody are shown in the insets in?c?and?d. Furthermore, the GFP+?cells from these BLM-treated mice were analyzed for Col I and F4/80 or Mac-3 expression after gating on GFP+?cells in the R1 region (region indicated by R2 in the inset in?e) (e?and?f). The Col I+?and F4/80+?cells represented 2.7% ± 0.76% of GFP+?cells (e). The Col I+?and Mac-3+?cells represented 5.5% ± 0.4% of GFP+?cells (f). Inset in?f?shows the cells stained with isotype-matched control IgG. Representative runs are shown for each group from a total of eight BLM-treated or saline-treated GFP BM chimera mice, respectively. Fig 4. PMID:?14722616
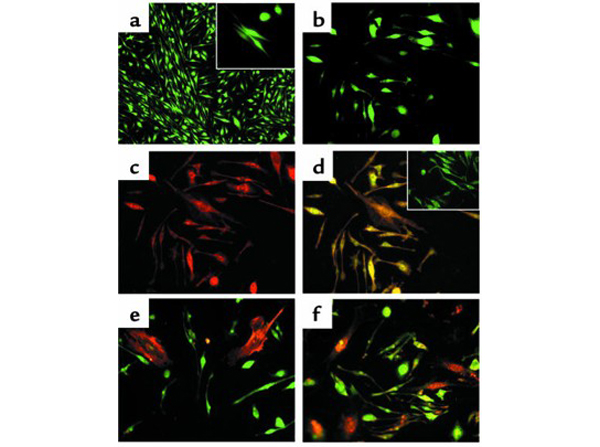
Characterization of cultured lung fibroblasts. Lung fibroblasts isolated from BLM-treated GFP BM chimera mice were analyzed by fluorescence microscopy (a?f). The cells showed typical fibroblast morphology, many being stellate or spindle-shaped (a). An average 80% of these cells expressed GFP (green fluorescence in?a, at ×100; inset at ×400). Cells were stained with both anti-GFP (green) and anti?Col I (red) antibodies in?b?d. The same microscopic field was photographed with the green (b) or red (c) filter only, or both simultaneously (d). Colocalization of both GFP and Col I expression resulted in a yellow color in?d. Inset in?d?shows the cells stained with anti-GFP antibody (green) and isotype-matched control IgG for Col I (red). Cells were also stained with both anti-GFP (green) and anti?α-SMA (red) antibodies (e). Colocalization of GFP and α-SMA should appear yellow, but the two α-SMA+?cells in this field did not appear to express GFP (e). Finally, cells were also stained with anti-GFP (green) and anti-TERT (red) antibodies. Colocalization of GFP and TERT appeared yellow, and most of the cells in this field expressed both TERT and GFP (f). Magnification was ×200 for?b?f. A representative example of at least three independent experiments is shown. Fig 5. PMID:?14722616
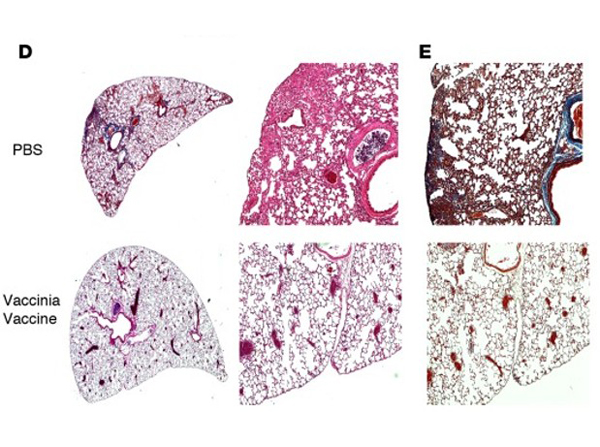
Histological analysis of lungs 42 days following i.p. bleomycin. (D) H&E staining of lung sections at ×20 (left panels) and ×100 (right panels) magnification. (E) Masson’s trichrome staining of lung sections at ×100 magnification.?Fig 1. PMID:?27158671
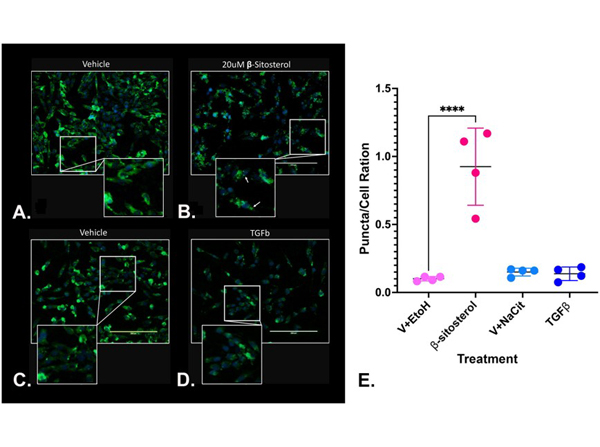
Beta-sitosterol treatment is associated with collagen sequestration in N1 cells. N1 cells treated with vehicle?+?ethanol, 20?μM beta-sitosterol, vehicle?+?sodium citrate or 4?ng/ml TGFβ were subjected to immunofluorescence for collagen 1. Collagen 1 distribution appeared similar between ethanol vehicle-, sodium citrate vehicle-, and TGFβ-treated cells but beta-sitosterol treated cells demonstrated a high number of internal fluorescently stained collagen protein in a ‘punctate’ type pattern (A). the puncta/cell ratio was significantly (p?< .001) higher in beta-sitosterol treated than other treated cells (B). puncta were counted in cells treated with ethanol vehicle (N?=?169), 20?μM beta-sitosterol (N?=?146), sodium citrate vehicle (N?=?175) or TGFβ (N?=?191). 14, 17, 16, and 22 puncta were identified and counted in ethanol vehicle-, 20?μM beta-sitosterol-, sodium citrate vehicle-, and TGFβ-treated cells, respectively. Fig 5. PMID:?37933457
|
|
|
|
Flow Cytometry of Anti-Collagen Type I Biotin Conjugated Antibody (600-406-103). Showing a 7.4% of fibrocyte population in the mouse lung using CD45 and Col 1A1 double positive markers. In the experiment, we used Biotinated Collagen Type 1 (p/n 600-406-103) in combination with a PE-conjugated secondary antibody for flow cytometric analysis. Courtesy of Walden Ai, PhD, Univ of SC School of Medicine.
|
|
| 別品名 |
rabbit anti-collagen type I antibody biotin conjugation, biotin conjugated rabbit anti-collagen type I antibody, Collagen Of Skin Tendon And Bone, Collagen Type 1 antibody, Collagen type I alpha 1 antibody, Collagen alpha-1 (I) chain, Alpha-1 type I collagen, type 1 procollagen alpha 1
|
| 由来詳細 |
[Species]Human/Bovine
|
| 交差種 |
Human
Mouse
Rat
|
| 適用 |
Flow Cytometry
Dot Blot
|
| 免疫動物 |
Rabbit
|
| 標識物 |
Biotin
|
| 精製度 |
Affinity Purified
|
| GENE ID |
1277
|
| Accession No.(Gene/Protein) |
NP_000079.2, P02452
|
| Gene Symbol |
COL1A1
|
| 参考文献 |
[[Cosmo Reference Collection]][Pub Med ID]14722616,26175529,27158671,27402952,29747640,23173053,23757729,27765762,30826294,31775048,32277974,33504617,32992711,35322016,34975874,37933457,36201508,40573254,41054530,41069120+他多数
|
| [注意事項] |
濃度はロットによって異なる可能性があります。メーカーDS及びCoAからご確認ください。
|
|
| メーカー |
品番 |
包装 |
|
RKL
|
600-406-103
|
0.1 MG
|
※表示価格について
| 当社在庫 |
なし
|
| 納期目安 |
約10日
|
| 法規制 |
毒
|
| 保存温度 |
4℃
|
|


