|
※サムネイル画像をクリックすると拡大画像が表示されます。
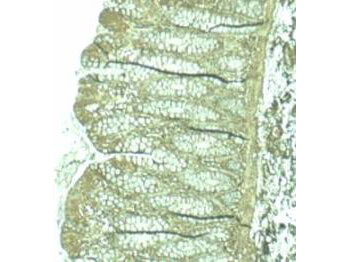
Affinity purified anti-Pdcd4 was used at a 1:100 dilution to detect Pdcd4 by immunohistochemistry on mouse colon tissue. Tissue was fixed in 4% paraformaldehyde and paraffin embedded. Tissue sections were deparaffinized and treated by trypsinization before staining. Personal Communication. M Young, NCI, Bethesda, MD.
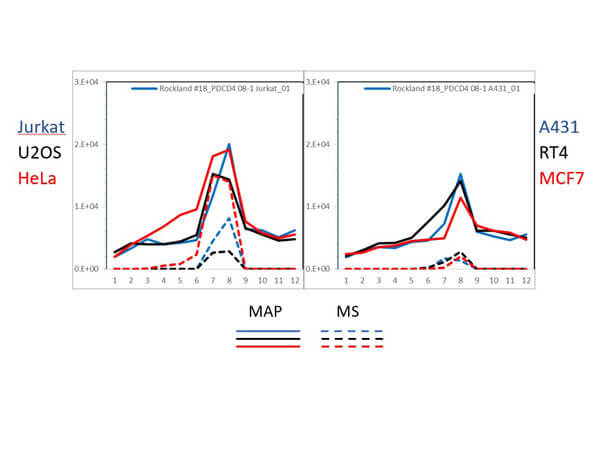
PAGE-MAP (microsphere affinity proteomics) of Rabbit Anti-PDCD4 Antibody. (Catalog Number: 600-401-965, Lot Number: 33416). Antibody array western blot binding of gelfree size separated fractions of multiple lysates (solid lines) and shotgun mass spectroscopy identification (dashed lines) of the target band run in parallel correlate confirming the specificity of this antibody against PDCD4. Data was provided by the Lund-Johansen lab of Oslo University Hospital. For more information on PAGE-MAP/IP-MS identification of antibody specificity and its large-scale implementation for antibody validation see Sikorski et. al., (2018) Nature Methods 15, 909-912.
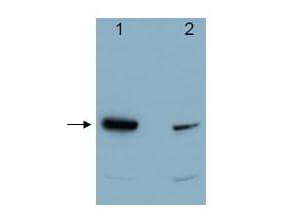
Western blot using Rockland's affinity purified anti-Pdcd4 antibody shows detection of a band ~52 kDa in size corresponding to Pdcd4 (arrowhead). Lane 1 contains recombinant Pdcd4. Lane 2 contains 293 HEK cells treated with TPA and MG132. The anti-Pdcd4 antibody was used at a 1: 5,000 dilution. Personal Communication. M Young & A Jansen, NCI, Bethesda, MD.
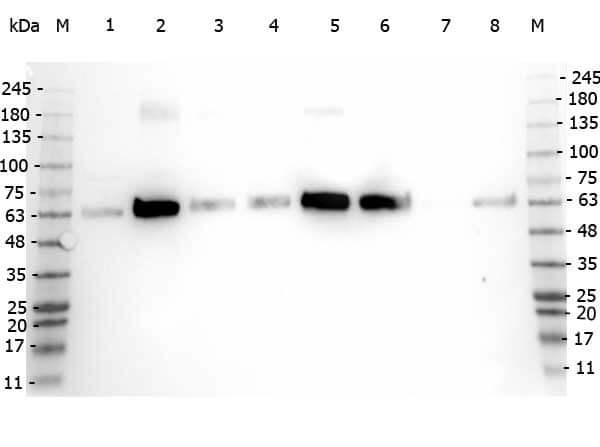
Western Blot of Rabbit anti-PDCD antibody. Marker: Opal Pre-stained ladder (p/n MB-210-0500). Lane 1: HEK293 lysate (p/n W09-000-365). Lane 2: HeLa Lysate (p/n W09-000-363). Lane 3: MCF-7 Lysate (p/n W09-000-360). Lane 4: Jurkat Lysate (p/n W09-000-370). Lane 5: A431 Lysate (p/n W09-000-361). Lane 6: Raji Lysate (p/n W09-001-368). Lane 7: Ramos Lysate (p/n W09-000-GK4). Lane 8: NIH/3T3 Lysate (p/n W10-000-358). Load: 35 μg per lane. Primary antibody: PDCD antibody at 1:1,000 for 3hrs at RT. Secondary antibody: Peroxidase rabbit secondary antibody (p/n 611-103-122) at 1:30,000 for 60 min at RT. Blocking Buffer: 1% Casein-TTBS (p/n MB-082) for 30 min at RT. Predicted/Observed size: 52 kDa for PDCD.
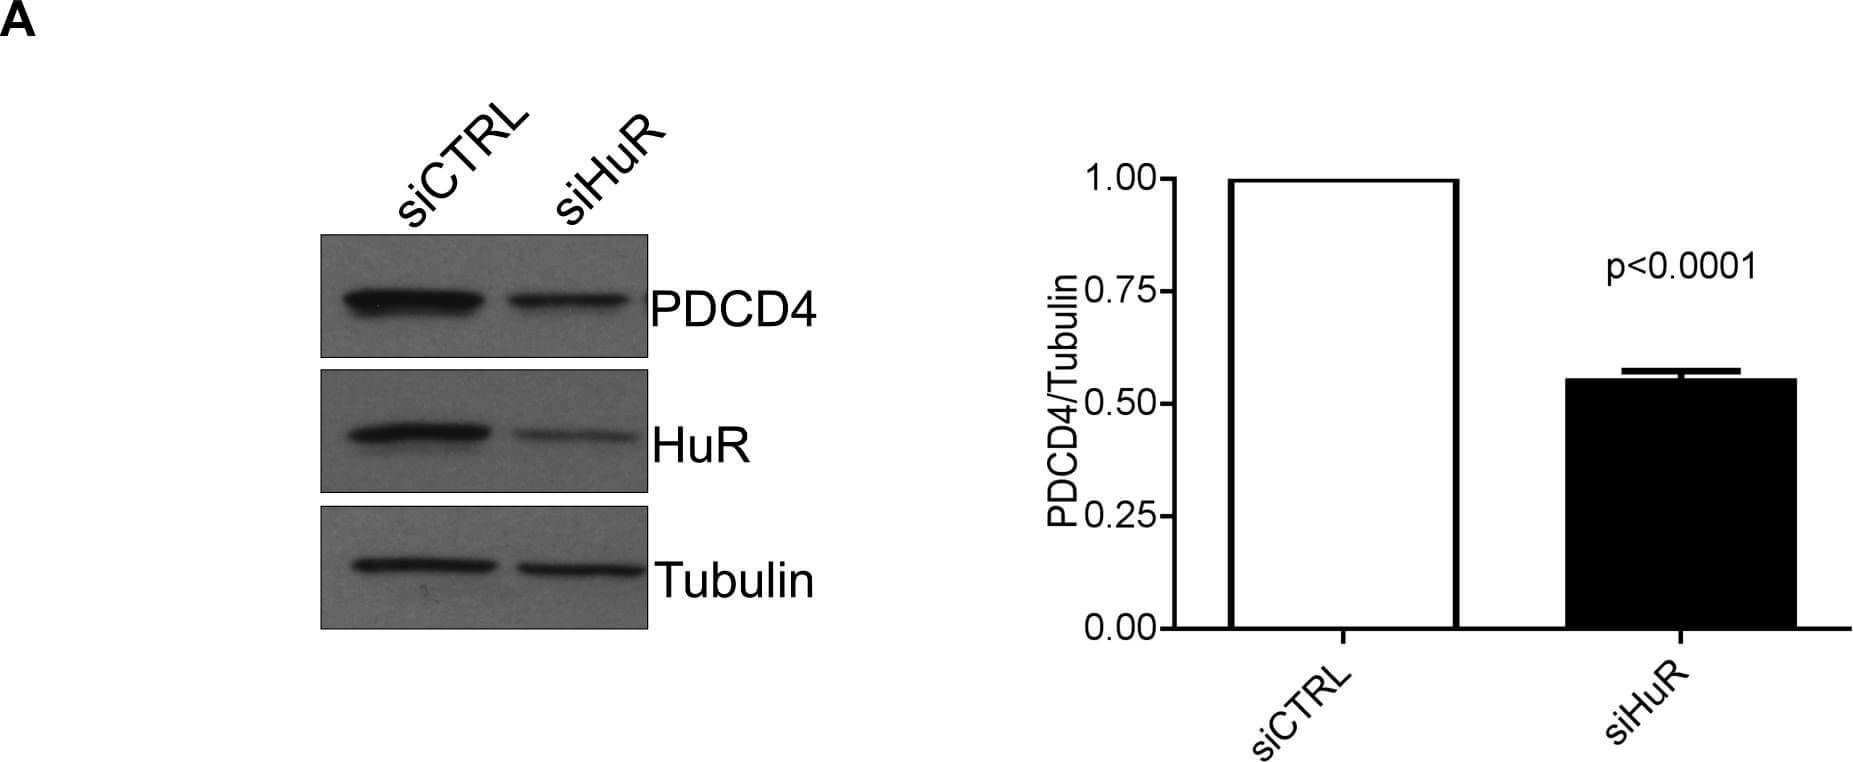
HuR directly binds to PDCD4 3′UTR mRNA to regulate its protein expressionA. Left panel: Western blot analysis of PDCD4 protein levels after HuR knockdown. HeLa cells were treated with siHuR or siCTRL (non-targeting control) for 72 h and harvested for western blot analysis. Tubulin was used as a loading control. Right panel: PDCD4 protein levels are quantified relative to Tubulin. B. HeLa cells were treated with siHuR or siCTRL for 72 h, harvested, and total RNA was isolated. PDCD4 mRNA levels were quantified by qRT-PCR and are shown relative to GAPDH mRNA levels. C. Seventy-two hours after siRNA transfection, HeLa cells were treated with 5 μg/mL actinomycin D. After the chase period, cells were processed for qRT-PCR to determine the mRNA half-life (11.6h for siCTRL; 9.5h for siHuR). D. Top panel: HeLa cells were crosslinked with formaldehyde and endogenous HuR was immunoprecipitated with mouse anti-HuR antibody; IgG was used as a control. Western blot analysis shows the level of immunoprecipitated HuR. Bottom panel: HuR-bound RNA was isolated and quantified by qRT-PCR, and is shown relative to IgG-immunoprecipitated material. The levels of GAPDH and RPL13 in HuR immunoprecipitation were determined as specificity controls E. PDCD4 3′UTR RNA was in vitro transcribed, 32P labelled and UV crosslinking was performed with recombinant GST (control) or GST-HuR, separated by SDS-PAGE, and exposed to X-Ray film. Figure provided by CiteAb. Source: Oncotarget, PMID: 26595526.
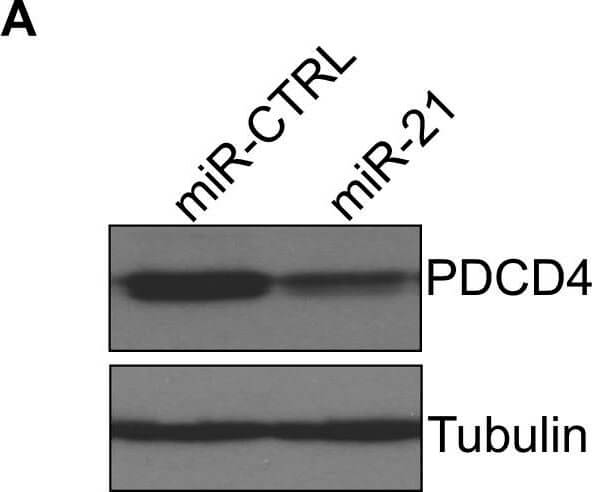
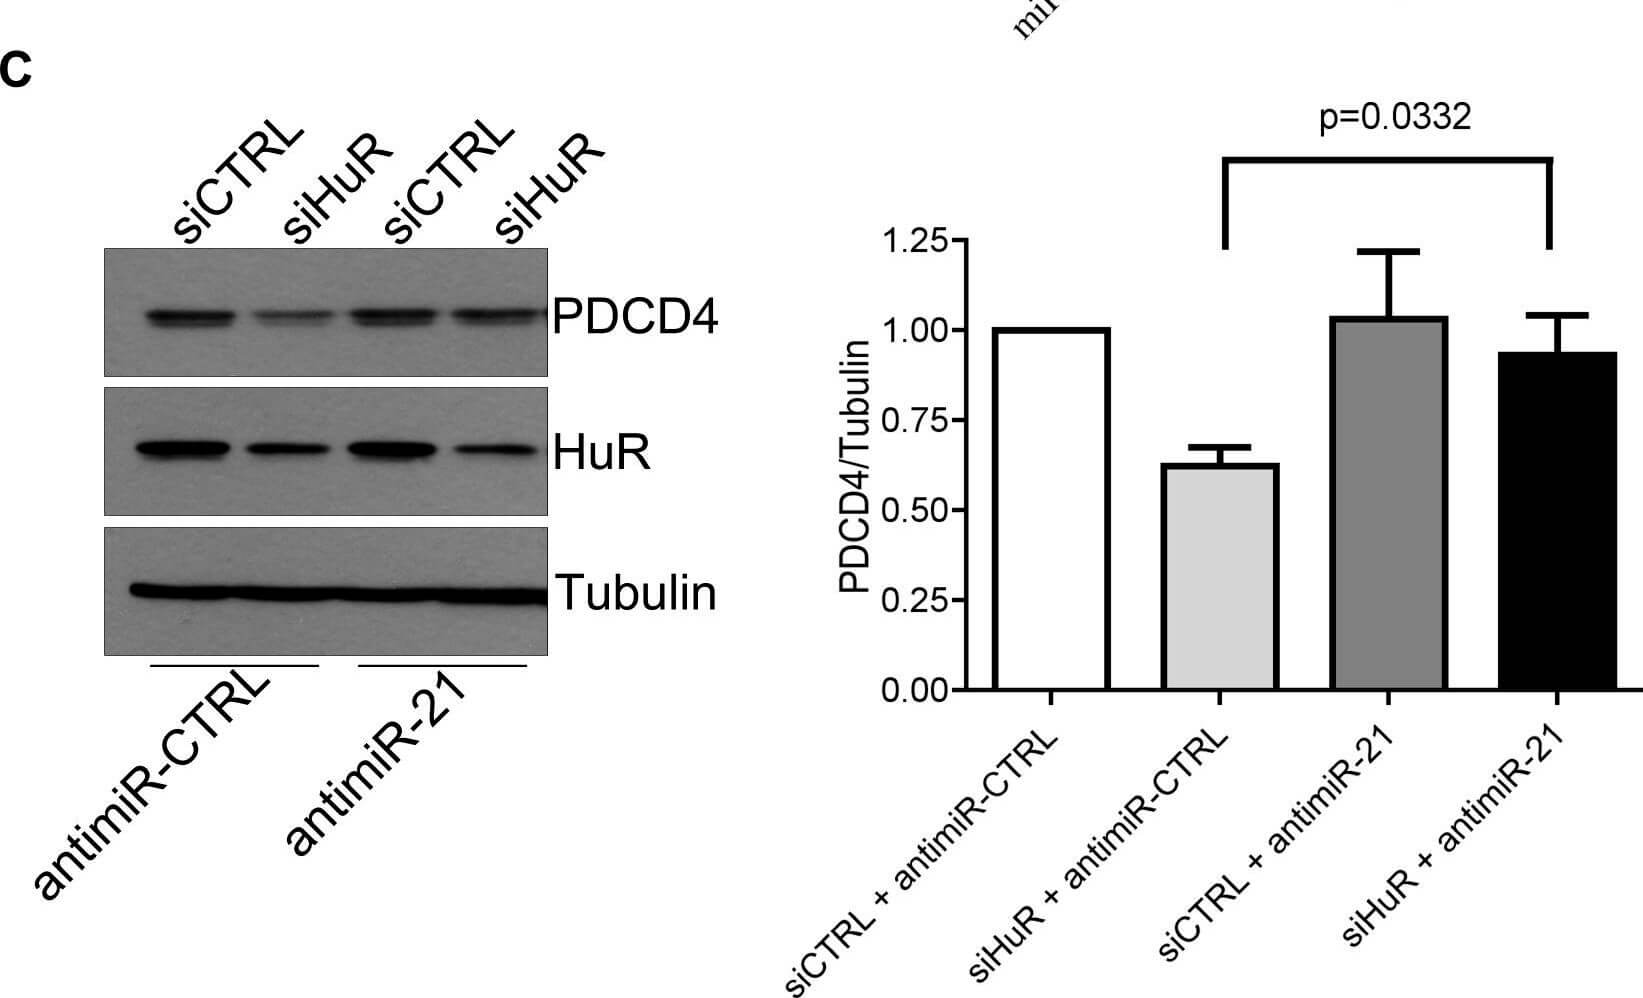
HuR regulates PDCD4 stability via miR-21A. HeLa cells were transiently transfected with a miR-21 mimic for 24 h and cells were harvested for western blot analysis. Tubulin was used as a loading control. B. HeLa cells were transiently transfected with a miR-21 mimic for 24 h and RNA was harvested. qRT-PCR analysis showing decrease of PDCD4 mRNA relative to GAPDH after miR-21 over-expression. C. Left panel: AntimiR-21 or antimiR-CTRL (control) was transiently transfected into HeLa cells for 24 h followed by siHuR transfection for an additional 48 h. Cells were harvested and protein levels were analyzed by western blot. Right panel: Quantification of PDCD4 protein levels relative to Tubulin. Figure provided by CiteAb. Source: Oncotarget, PMID: 26595526.
HuR regulates PDCD4 stability via miR-21A. HeLa cells were transiently transfected with a miR-21 mimic for 24 h and cells were harvested for western blot analysis. Tubulin was used as a loading control. B. HeLa cells were transiently transfected with a miR-21 mimic for 24 h and RNA was harvested. qRT-PCR analysis showing decrease of PDCD4 mRNA relative to GAPDH after miR-21 over-expression. C. Left panel: AntimiR-21 or antimiR-CTRL (control) was transiently transfected into HeLa cells for 24 h followed by siHuR transfection for an additional 48 h. Cells were harvested and protein levels were analyzed by western blot. Right panel: Quantification of PDCD4 protein levels relative to Tubulin. Figure provided by CiteAb. Source: Oncotarget, PMID: 26595526.
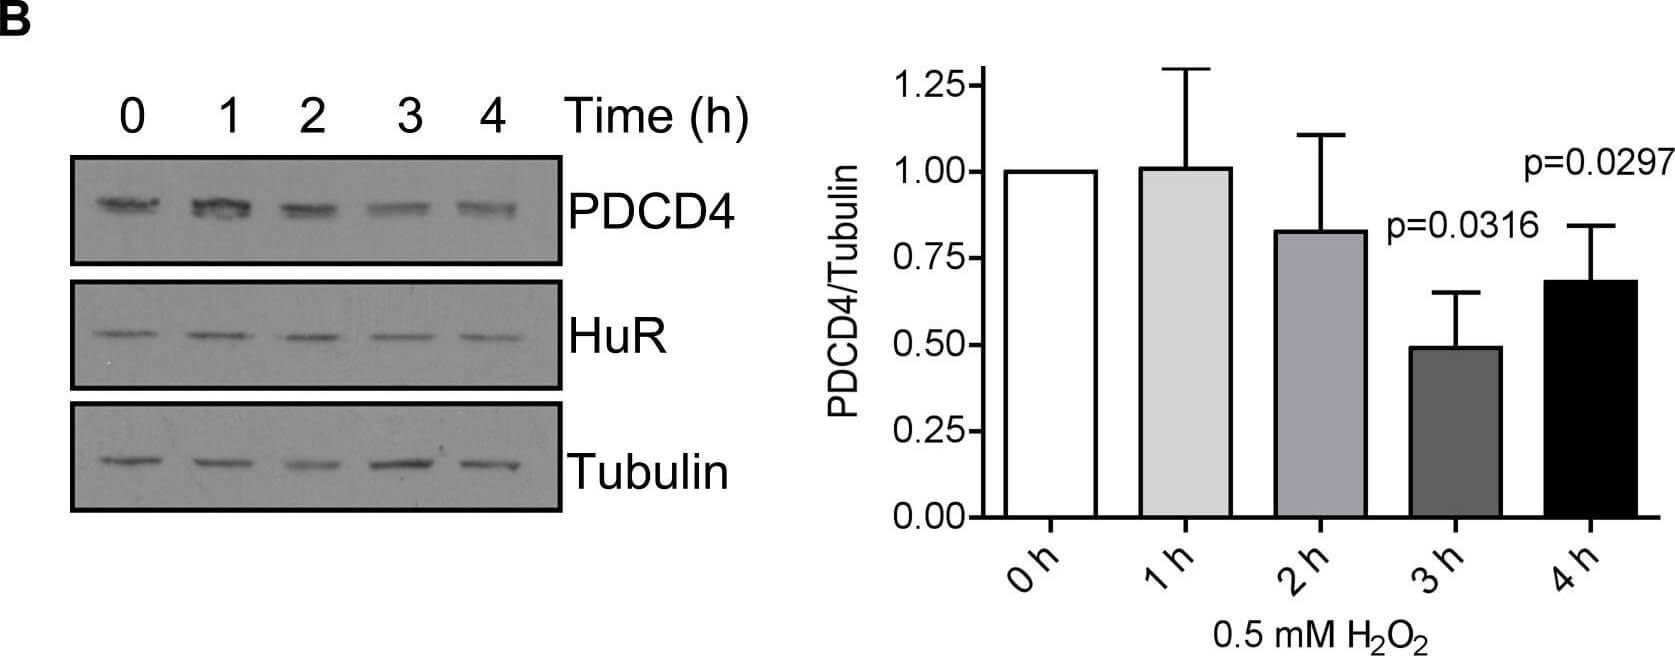
H2O2 causes cytoplasmic accumulation of HuR and a loss in PDCD4 expression that is mediated by miR-21A. HuR localization by immunofluorescence of HeLa cells treated with PBS (0 mM H2O2) or 0.5 mM H2O2 for 1 h. Nuclei are visualized by Hoechst staining. Nuclear/Cytoplasmic ratio of HuR is shown on the right. Higher ratio denotes more nuclear staining. B. Left panel: HeLa cells were treated with 0.5 mM H2O2 for the indicated times and cell lysates analysed by western blot analysis indicating a decrease in PDCD4 protein at 3 h as compared to Tubulin control. Right panel: PDCD4 protein levels were quantified relative to Tubulin. C. Cells were treated with 0.5 mM H2O2 for the indicated time points, total RNA was isolated and analysed by qRT-PCR indicating a loss of PDCD4 mRNA as compared to GAPDH control. D. Left panel: HeLa cells were treated with antimiR-21 or a non-targeting antimiR-CTRL (control) for 24 h followed by treatment with 0.5 mM H2O2 for 4 h. Cells were harvested and analysed by western blot analysis. Tubulin was used as a loading control. Right panel: Quantification of PDCD4 levels relative to Tubulin. E. HeLa cells were treated with 0.5 mM H2O2 or PBS and HuR was immunoprecipitated. Bound RNA was isolated and qRT-PCR was performed to determine levels of PDCD4 mRNA. The levels of HuR-bound PDCD4 in PBS-treated cells were set as 1. Figure provided by CiteAb. Source: Oncotarget, PMID: 26595526.
H2O2 causes cytoplasmic accumulation of HuR and a loss in PDCD4 expression that is mediated by miR-21A. HuR localization by immunofluorescence of HeLa cells treated with PBS (0 mM H2O2) or 0.5 mM H2O2 for 1 h. Nuclei are visualized by Hoechst staining. Nuclear/Cytoplasmic ratio of HuR is shown on the right. Higher ratio denotes more nuclear staining. B. Left panel: HeLa cells were treated with 0.5 mM H2O2 for the indicated times and cell lysates analysed by western blot analysis indicating a decrease in PDCD4 protein at 3 h as compared to Tubulin control. Right panel: PDCD4 protein levels were quantified relative to Tubulin. C. Cells were treated with 0.5 mM H2O2 for the indicated time points, total RNA was isolated and analysed by qRT-PCR indicating a loss of PDCD4 mRNA as compared to GAPDH control. D. Left panel: HeLa cells were treated with antimiR-21 or a non-targeting antimiR-CTRL (control) for 24 h followed by treatment with 0.5 mM H2O2 for 4 h. Cells were harvested and analysed by western blot analysis. Tubulin was used as a loading control. Right panel: Quantification of PDCD4 levels relative to Tubulin. E. HeLa cells were treated with 0.5 mM H2O2 or PBS and HuR was immunoprecipitated. Bound RNA was isolated and qRT-PCR was performed to determine levels of PDCD4 mRNA. The levels of HuR-bound PDCD4 in PBS-treated cells were set as 1. Figure provided by CiteAb. Source: Oncotarget, PMID: 26595526.
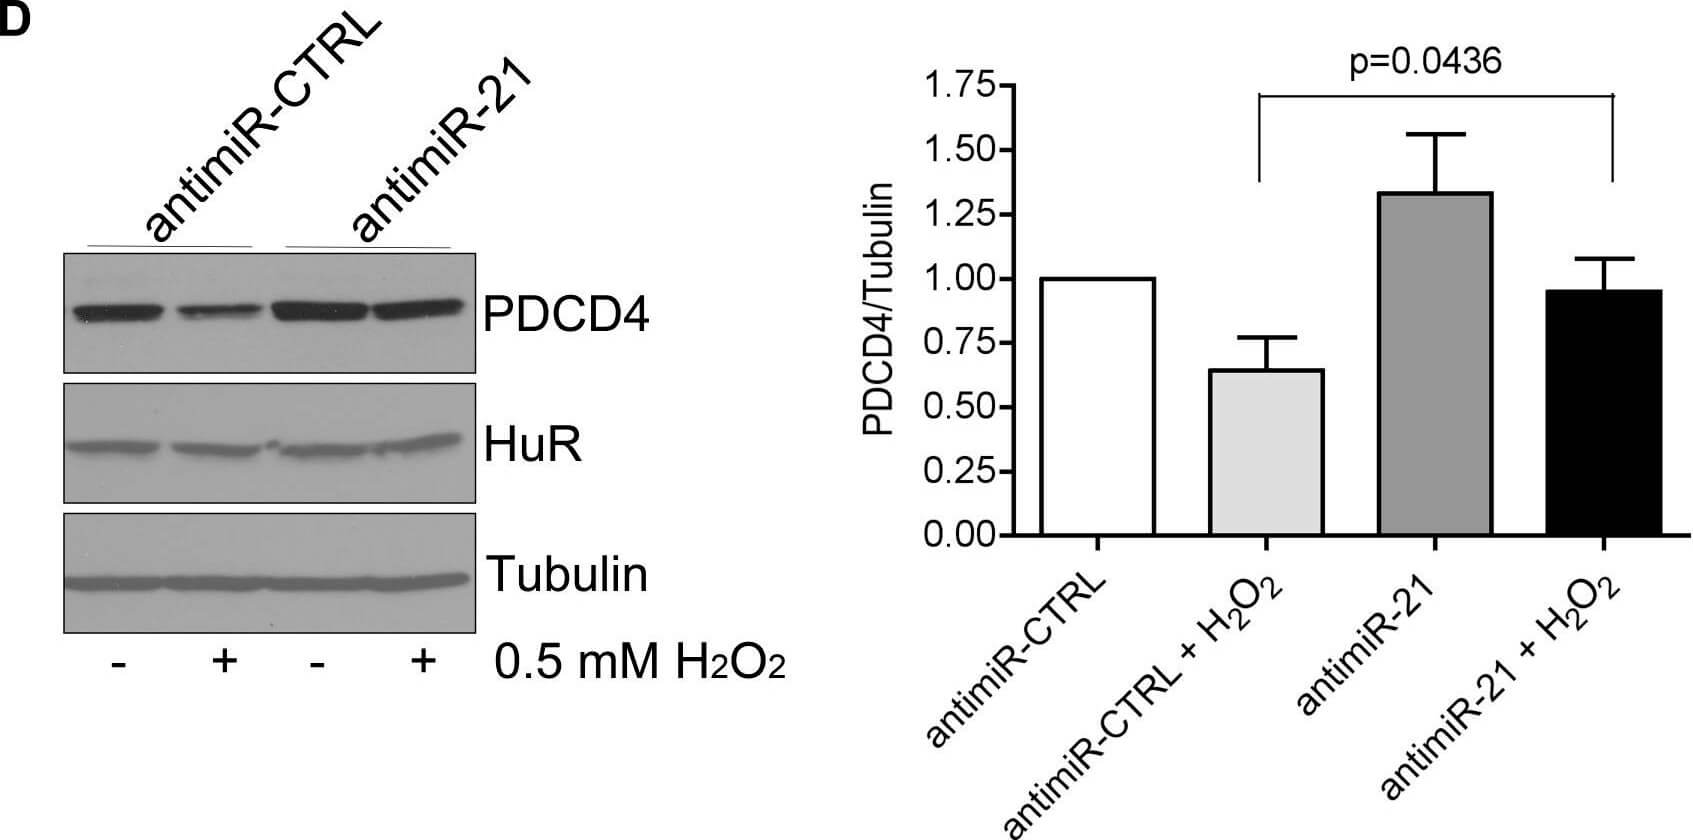
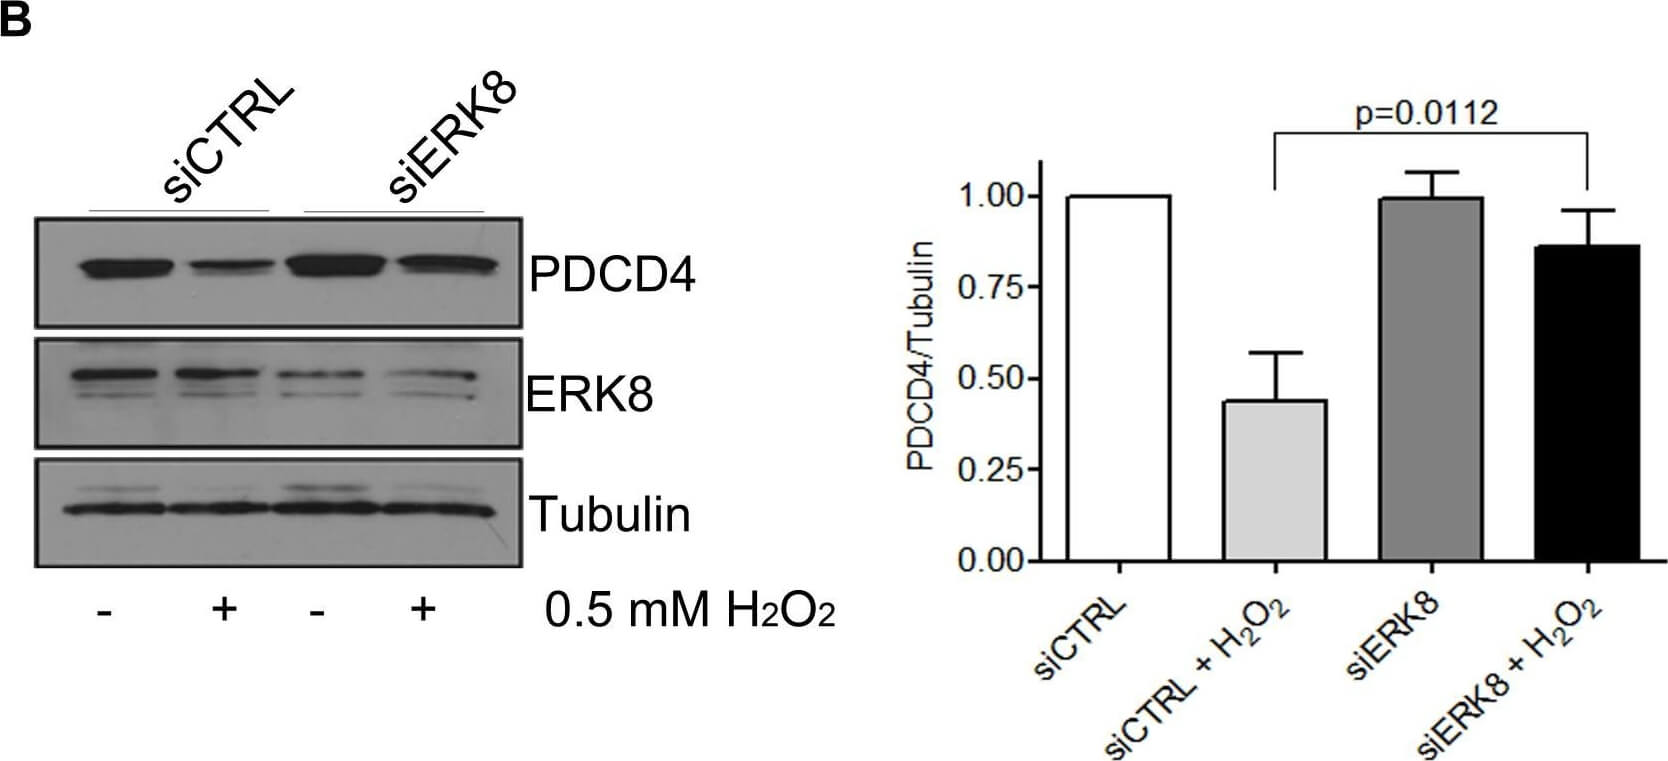
ERK8 phosphorylates HuR to prevent its binding to PDCD4 mRNAA. ERK8 or control siRNA was transfected into HeLa cells for 48 h followed by treatment of cells with 0.5 mM H2O2 or PBS for 1 h. Cells were fixed and immunofluorescence was performed to monitor HuR localization. Hoechst was used to stain the nuclei. Nuclear/Cytoplasmic ratio of HuR is shown on the right. Higher ratio denotes more nuclear staining. B. Top panel: HeLa cells were treated as in (A) and cells were harvested for western blot analysis for indicated proteins. Bottom panel: Quantification of PDCD4 protein levels relative to Tubulin. C. The kinase assay was performed with immunoprecipitated Flag-HuR or Flag empty vector as substrate and HA-ERK8 kinase in the presence of 32P gamma-ATP and exposed to X-ray film. The levels of HuR and ERK8 proteins were detected by western blot analysis. Figure provided by CiteAb. Source: Oncotarget, PMID: 26595526.
|
|
|
|
Affinity purified anti-Pdcd4 was used at a 1:100 dilution to detect Pdcd4 by immunohistochemistry on mouse colon tissue. Tissue was fixed in 4% paraformaldehyde and paraffin embedded. Tissue sections were deparaffinized and treated by trypsinization before staining. Personal Communication. M Young, NCI, Bethesda, MD.
|
|
| 別品名 |
rabbit anti-PDCD4 antibody, PDCD-4, PDCD 4, Programmed cell death protein 4, Death up-regulated gene protein antibody, Dug antibody, H731 antibody, Ma3 antibody, Neoplastic transformation inhibitor antibody, Neoplastic transformation inhibitor protein antibody, Nuclear antigen H731 antibody, Protein 197/15a
|
| 交差種 |
Human
Mouse
|
| 適用 |
Western Blot
Enzyme Linked Immunosorbent Assay
Immunohistochemistry
|
| 免疫動物 |
Rabbit
|
| 抗原部位 |
C-terminus
|
| 標識物 |
Unlabeled
|
| 精製度 |
Affinity Purified
|
| GENE ID |
27250
|
| Accession No.(Gene/Protein) |
21735596, Q53EL6
|
| Gene Symbol |
PDCD4
|
| 参考文献 |
[Pub Med ID]26595526
|
|
| メーカー |
品番 |
包装 |
|
RKL
|
600-401-965
|
100 UG
|
※表示価格について
| 当社在庫 |
なし
|
| 納期目安 |
約10日
|
| 保存温度 |
-20℃
|
|
※当社では商品情報の適切な管理に努めておりますが、表示される法規制情報は最新でない可能性があります。
また法規制情報の表示が無いものは、必ずしも法規制に非該当であることを示すものではありません。
商品のお届け前に最新の製品法規制情報をお求めの際はこちらへお問い合わせください。
|
※当社取り扱いの試薬・機器製品および受託サービス・創薬支援サービス(納品物、解析データ等)は、研究用としてのみ販売しております。
人や動物の医療用・臨床診断用・食品用としては、使用しないように、十分ご注意ください。
法規制欄に体外診断用医薬品と記載のものは除きます。
|
|
※リンク先での文献等のダウンロードに際しましては、掲載元の規約遵守をお願いします。
|
|
※CAS Registry Numbers have not been verified by CAS and may be inaccurate.
|