|
※サムネイル画像をクリックすると拡大画像が表示されます。
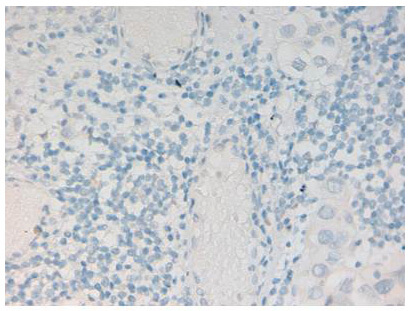
Immunohistochemistry with anti-Histone Antibody. Tissue: Human Bladder Cancer. Fixation: FFPE buffered formalin 10% conc. Ag Retrieval: HIER citrate buffer pH6 or HIER EDTA pH9. Primary antibody: 2 ug/ml at 2 hr. Secondary Ab: anti rabbit polymer HRP 20 ‘ RT.
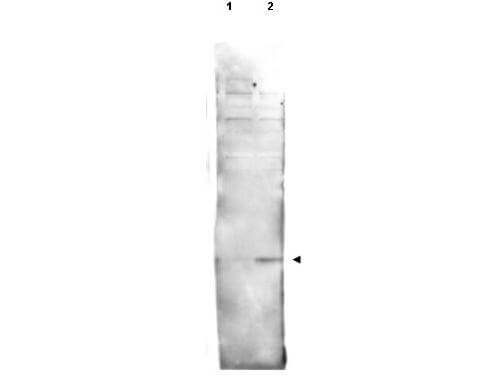
Western blot using Rockland's affinity purified anti-histone H2AvD pS137 antibody shows detection of a band at ~15 kDa corresponding to phosphorylated H2AvD (lane 2 arrow-head). Lane 1: mock-irradiated Drosophila melanogaster (3rd instar) larvae brain WC lysate. Lane 2: 4000-RAD gamma irradiated Drosophila melanogaster (3rd instar) larvae brain WC lysate. Separated on by SDS-PAGE and transferred to nitrocellulose. After blocking the membrane was probed with the primary antibody diluted to 1:500. Washes and reaction with secondary antibody followed incubation. Use HRP conjugated Gt-a-Rabbit IgG [H&L] MX (p/n 611-103-122) and ECL for detection. Personal Communication. Yikang Rong, NIH, CCR, Bethesda, MD.
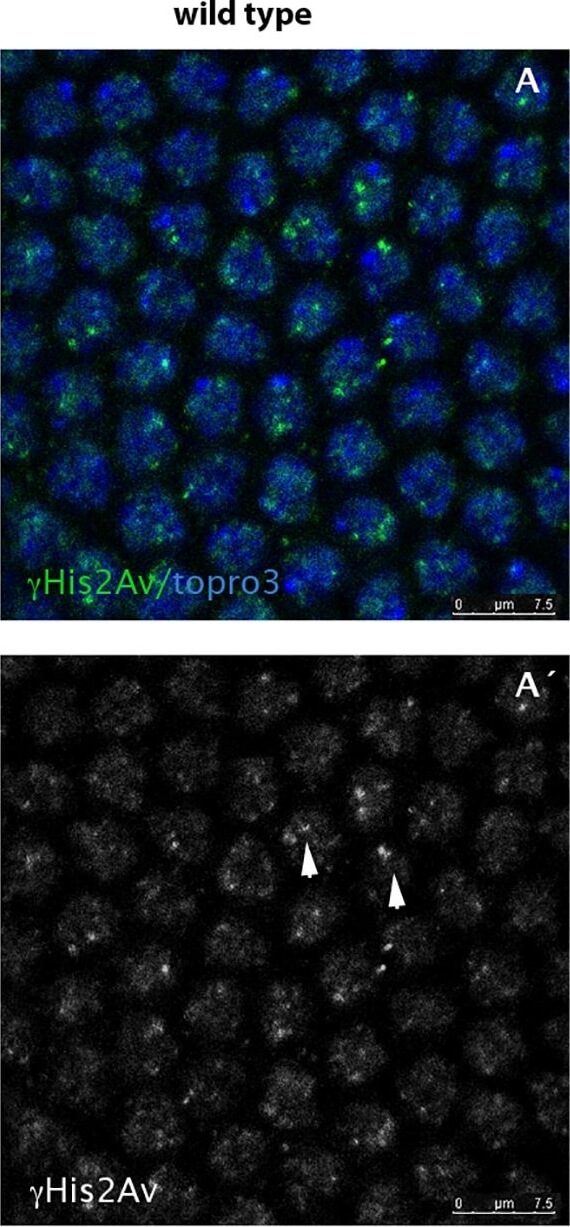
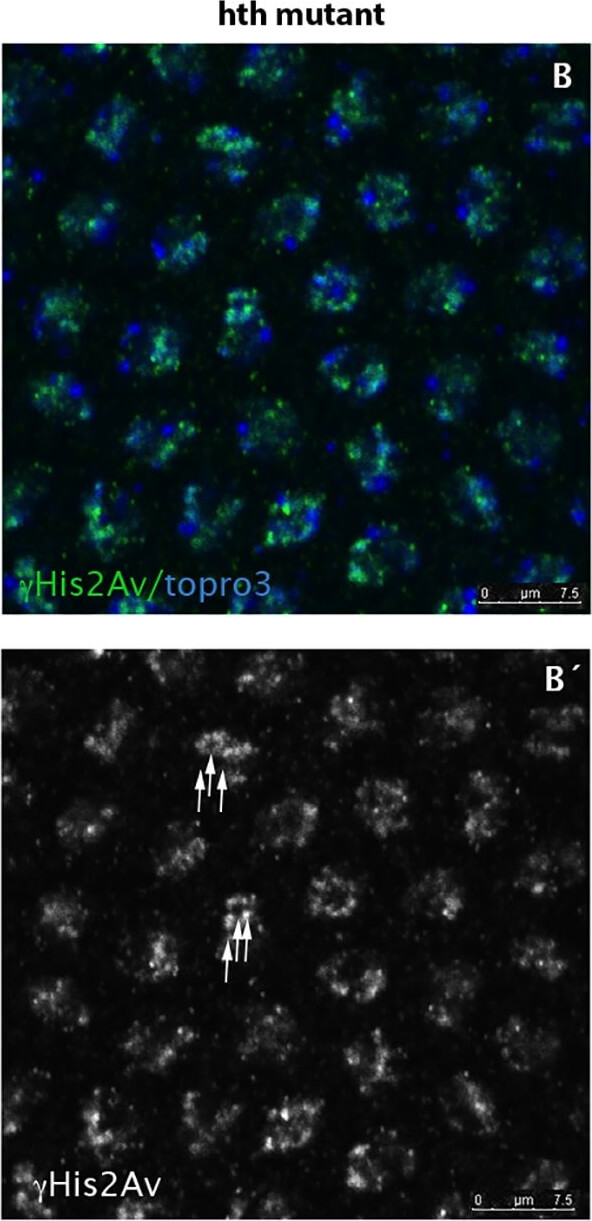
hth mutant nuclei show increased number of DNA breaks.A,A´) Wild type syncytium (cycle 11) stained for His2AvP (green) and topro3 (blue). Due to the lack of mitotic checkpoints during the rapid syncytial divisions the nuclei show some degree of DNA breaks marked with the anti-His2AvP antibody (arrowheads in A´). B, B´) However, hth mutant nuclei show more nuclear signal when stained with the same antibody (see arrows in B´) indicating that they have more breaks in their DNA. C) Quantification of the DNA breaks in the Dfhth mutant embryos and in their wild type siblings. Quantification was performed by counting the number of nuclear dots marked with the anti-His2AvP antibody. (N = 50 nuclei for each genotype from 5 different embryos each. P-value: 7,0085X10⁻⁵). Figure provided by CiteAb. Source: PLoS One, PMID: 25794008.
hth mutant nuclei show increased number of DNA breaks.A,A´) Wild type syncytium (cycle 11) stained for His2AvP (green) and topro3 (blue). Due to the lack of mitotic checkpoints during the rapid syncytial divisions the nuclei show some degree of DNA breaks marked with the anti-His2AvP antibody (arrowheads in A´). B, B´) However, hth mutant nuclei show more nuclear signal when stained with the same antibody (see arrows in B´) indicating that they have more breaks in their DNA. C) Quantification of the DNA breaks in the Dfhth mutant embryos and in their wild type siblings. Quantification was performed by counting the number of nuclear dots marked with the anti-His2AvP antibody. (N = 50 nuclei for each genotype from 5 different embryos each. P-value: 7,0085X10⁻⁵). Figure provided by CiteAb. Source: PLoS One, PMID: 25794008.
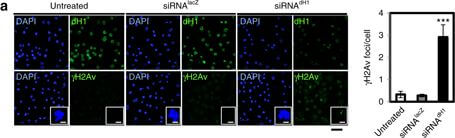
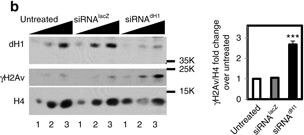
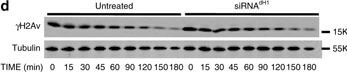
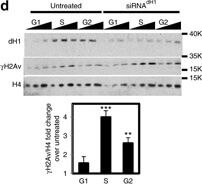
dH1 depletion induces DNA damage. a Immunostaining of dH1-depleted (siRNAdH1) and control undepleted cells (siRNAlacZ and untreated) with αdH1 and αγH2Av antibodies (both in green). DNA was stained with DAPI (blue). Insets show enlarged images of representative individual cells. Scale bars are 20?μm and 2?μm in the Insets. On the right, the number of γH2Av foci per cell is presented (n?>?100 for each condition). Error bars are s.e.m. The p-value of siRNAdH1 respect to siRNAlacZ is indicated (***p<0.005; two-tailed Student’s t-test). b WB analyses with αdH1, αγH2Av and αH4 of increasing amounts of extracts (lanes 1?3) prepared from siRNAdH1, siRNAlacZ and untreated cells. The positions corresponding to molecular weight markers are indicated. On the right, quantitative analysis of the results (N?=?3). Error bars are s.e.m. The p-value of siRNAdH1 respect to siRNAlacZ is indicated (***<0.005; two-tailed Student’s t-test). c Alkaline and neutral single-cell electrophoresis analyses of siRNAdH1, siRNAlacZ and untreated cells. Scale bar corresponds to 20?μm. On the right, relative comet-tail moments are presented (n?>?100 for each condition). Error bars are s.e.m. The p-values of siRNAdH1 respect to siRNAlacZ are indicated (***<0.005; two-tailed Student’s t-test). d On the top, WB analysis with αγH2Av and αtubulin at different time points after X-ray irradiation (10?Gy) of siRNAdH1 and untreated cells. The positions corresponding to molecular weight markers are indicated. On the bottom, quantitative analysis of the results (N?=?3) Figure provided by CiteAb. Source: Nat Commun, PMID: 28819201.
dH1 depletion induces DNA damage. a Immunostaining of dH1-depleted (siRNAdH1) and control undepleted cells (siRNAlacZ and untreated) with αdH1 and αγH2Av antibodies (both in green). DNA was stained with DAPI (blue). Insets show enlarged images of representative individual cells. Scale bars are 20?μm and 2?μm in the Insets. On the right, the number of γH2Av foci per cell is presented (n?>?100 for each condition). Error bars are s.e.m. The p-value of siRNAdH1 respect to siRNAlacZ is indicated (***p<0.005; two-tailed Student’s t-test). b WB analyses with αdH1, αγH2Av and αH4 of increasing amounts of extracts (lanes 1?3) prepared from siRNAdH1, siRNAlacZ and untreated cells. The positions corresponding to molecular weight markers are indicated. On the right, quantitative analysis of the results (N?=?3). Error bars are s.e.m. The p-value of siRNAdH1 respect to siRNAlacZ is indicated (***<0.005; two-tailed Student’s t-test). c Alkaline and neutral single-cell electrophoresis analyses of siRNAdH1, siRNAlacZ and untreated cells. Scale bar corresponds to 20?μm. On the right, relative comet-tail moments are presented (n?>?100 for each condition). Error bars are s.e.m. The p-values of siRNAdH1 respect to siRNAlacZ are indicated (***<0.005; two-tailed Student’s t-test). d On the top, WB analysis with αγH2Av and αtubulin at different time points after X-ray irradiation (10?Gy) of siRNAdH1 and untreated cells. The positions corresponding to molecular weight markers are indicated. On the bottom, quantitative analysis of the results (N?=?3) Figure provided by CiteAb. Source: Nat Commun, PMID: 28819201.
dH1 depletion induces DNA damage. a Immunostaining of dH1-depleted (siRNAdH1) and control undepleted cells (siRNAlacZ and untreated) with αdH1 and αγH2Av antibodies (both in green). DNA was stained with DAPI (blue). Insets show enlarged images of representative individual cells. Scale bars are 20?μm and 2?μm in the Insets. On the right, the number of γH2Av foci per cell is presented (n?>?100 for each condition). Error bars are s.e.m. The p-value of siRNAdH1 respect to siRNAlacZ is indicated (***p<0.005; two-tailed Student’s t-test). b WB analyses with αdH1, αγH2Av and αH4 of increasing amounts of extracts (lanes 1?3) prepared from siRNAdH1, siRNAlacZ and untreated cells. The positions corresponding to molecular weight markers are indicated. On the right, quantitative analysis of the results (N?=?3). Error bars are s.e.m. The p-value of siRNAdH1 respect to siRNAlacZ is indicated (***<0.005; two-tailed Student’s t-test). c Alkaline and neutral single-cell electrophoresis analyses of siRNAdH1, siRNAlacZ and untreated cells. Scale bar corresponds to 20?μm. On the right, relative comet-tail moments are presented (n?>?100 for each condition). Error bars are s.e.m. The p-values of siRNAdH1 respect to siRNAlacZ are indicated (***<0.005; two-tailed Student’s t-test). d On the top, WB analysis with αγH2Av and αtubulin at different time points after X-ray irradiation (10?Gy) of siRNAdH1 and untreated cells. The positions corresponding to molecular weight markers are indicated. On the bottom, quantitative analysis of the results (N?=?3) Figure provided by CiteAb. Source: Nat Commun, PMID: 28819201.
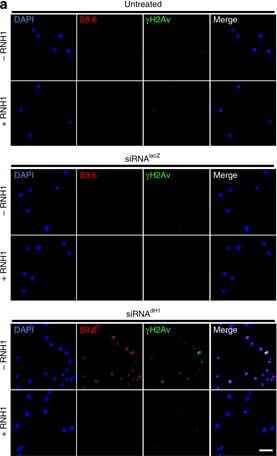
DNA damage induced by dH1 depletion associates with R-loops accumulation. a Immunostainings with αγH2Av (green) and S9.6 (red) antibodies of siRNAdH1, siRNAlacZ and untreated cells overexpressing human RNH1 (+) or not (−). Scale bar corresponds to 10?μm. b Quantitative analysis of the results shown in a. S9.6 (top) and γH2Av (center) reactivities determined as the proportion of DAPI area stained with S9.6 antibodies and the number of γH2Av foci per cell are presented (n?>?50 for each condition). On the bottom, the extent of γH2Av/S9.6 colocalization is presented as the proportion of γH2Av area overlapping with S9.6 reactivity (n?>?50 for each condition). Error bars are s.e.m. The p-values of siRNAdH1 respect to siRNAlacZ are indicated (no asterisk >0.05, ***<0.005; two-tailed Student’s t-test). c αγH2Av (top) and S9.6 (bottom) reactivities of G1-, S- and G2/M-phase sorted siRNAdH1, siRNAlacZ and untreated cells overexpressing RNH1 (+) or not (−) are presented as in b (n?>?50 for each condition). Error bars are s.e.m. The p-values of siRNAdH1 respect to siRNAlacZ are indicated (no asterisk >0.05, ***<0.005; two-tailed Student’s t-test). d WB analyses with αdH1, αγH2Av and αH4 antibodies of siRNAdH1 and untreated cells sorted at G1-, S and G2/M-phase. The positions corresponding to molecular weight markers are indicated. Quantitative analysis is shown on the bottom (N?=?2). Error bars are s.e.m. The p-values respect to untreated are indicated (no asterisk >0.05, **<0.01, ***<0.005; two-tailed Student’s t-test) Figure provided by CiteAb. Source: Nat Commun, PMID: 28819201.
DNA damage induced by dH1 depletion associates with R-loops accumulation. a Immunostainings with αγH2Av (green) and S9.6 (red) antibodies of siRNAdH1, siRNAlacZ and untreated cells overexpressing human RNH1 (+) or not (−). Scale bar corresponds to 10?μm. b Quantitative analysis of the results shown in a. S9.6 (top) and γH2Av (center) reactivities determined as the proportion of DAPI area stained with S9.6 antibodies and the number of γH2Av foci per cell are presented (n?>?50 for each condition). On the bottom, the extent of γH2Av/S9.6 colocalization is presented as the proportion of γH2Av area overlapping with S9.6 reactivity (n?>?50 for each condition). Error bars are s.e.m. The p-values of siRNAdH1 respect to siRNAlacZ are indicated (no asterisk >0.05, ***<0.005; two-tailed Student’s t-test). c αγH2Av (top) and S9.6 (bottom) reactivities of G1-, S- and G2/M-phase sorted siRNAdH1, siRNAlacZ and untreated cells overexpressing RNH1 (+) or not (−) are presented as in b (n?>?50 for each condition). Error bars are s.e.m. The p-values of siRNAdH1 respect to siRNAlacZ are indicated (no asterisk >0.05, ***<0.005; two-tailed Student’s t-test). d WB analyses with αdH1, αγH2Av and αH4 antibodies of siRNAdH1 and untreated cells sorted at G1-, S and G2/M-phase. The positions corresponding to molecular weight markers are indicated. Quantitative analysis is shown on the bottom (N?=?2). Error bars are s.e.m. The p-values respect to untreated are indicated (no asterisk >0.05, **<0.01, ***<0.005; two-tailed Student’s t-test) Figure provided by CiteAb. Source: Nat Commun, PMID: 28819201.
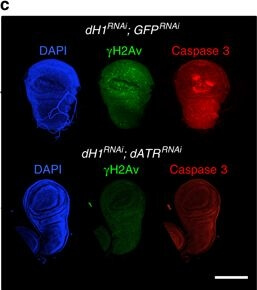
R-loops induced by dH1 depletion activate JNK-dependent apoptosis. a Wings from dH1-depleted his1RNAi flies of the indicated genotypes where dH1 depletion was induced in the pouch region of the wing imaginal disc. Scale bar corresponds to 500?μm. b Quantitative analysis of the wing area of dH1-depleted his1RNAi flies of the indicated genotypes. Data is expressed as fold change respect to control dH1-depleted his1RNAi; GFPRNAi (n?>?20 for each condition). Error bars are s.e.m. The p-values respect to control his1RNAi; GFPRNAi are indicated (**<0.01, ***<0.005; two-tailed Student’s t-test). c Immunostaining with αγH2Av (green) and αCaspase 3 (red) of wing imaginal discs from dH1-depleted his1RNAi flies upon dATRRNAi co-depletion (bottom) or not (top). DNA was stained with DAPI (blue). d Immunostaining with αCaspase 3 (red) of wing imaginal discs from dH1-depleted his1RNAi flies upon p53RNAi co-depletion (bottom) or p53H159N overexpression (top). DNA was stained with DAPI (blue). e As in d but upon bskRNAi co-depletion (top) or puc2A overexpression (bottom). Scale bars in c?e are 200?μm Figure provided by CiteAb. Source: Nat Commun, PMID: 28819201.
|
|
|
|
Immunohistochemistry with anti-Histone Antibody. Tissue: Human Bladder Cancer. Fixation: FFPE buffered formalin 10% conc. Ag Retrieval: HIER citrate buffer pH6 or HIER EDTA pH9. Primary antibody: 2 ug/ml at 2 hr. Secondary Ab: anti rabbit polymer HRP 20 ‘ RT.
|
|
| 別品名 |
rabbit anti-H2AvD pS137 antibody, rabbit anti-Histone H2A.v pS137 antibody, H2AvD protein antibody, H2A.F/Z, H2A.Z, H2AvD, His2AvD, His2Av
|
| 交差種 |
Drosophila melanogaster
|
| 適用 |
Western Blot
Enzyme Linked Immunosorbent Assay
Immunohistochemistry
|
| 免疫動物 |
Rabbit
|
| 抗原部位 |
a.a.132-141
|
| 標識物 |
Unlabeled
|
| 精製度 |
Affinity Purified
|
| 翻訳後修飾 |
リン酸化
|
| GENE ID |
43229
|
| Accession No.(Gene/Protein) |
17738227, P08985
|
| Gene Symbol |
His2Av
|
| 参考文献 |
[Pub Med ID]25794008
|
| [注意事項] |
濃度はロットによって異なる可能性があります。メーカーDS及びCoAからご確認ください。
|
|
| メーカー |
品番 |
包装 |
|
RKL
|
600-401-914
|
100 UG
|
※表示価格について
| 当社在庫 |
なし
|
| 納期目安 |
約10日
|
| 保存温度 |
-20℃
|
|