|
※サムネイル画像をクリックすると拡大画像が表示されます。
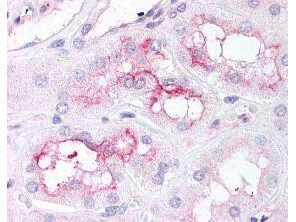
Rockland's affinity purified anti-mTOR pS 2448 antibody was used at 5 μg/ml to detect signal in a variety of tissues including multi-human, multi-brain and multi-cancer slides. This image shows moderate staining of proximal convoluted tubules of the kidney (40X). Tissue was formalin-fixed and paraffin embedded. The image shows localization of the antibody as the precipitated red signal, with a hematoxylin purple nuclear counterstain. Personal Communication, Tina Roush, LifeSpanBiosciences, Seattle, WA.
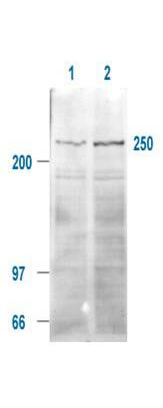
Affinity Purified Anti-mTOR pS 2448 (Rabbit) is shown to detect a 250 kDa band (indicated) corresponding to phosphorylated human mTOR present in a 293T whole cell lysates. Cells were serum-starved for 24 hours prior to harvest. ~20 ug of lysate was loaded per lane for SDS-PAGE. Untreated cells are shown in lane 1, whereas cells in lane 2 were treated with IGF-1 (100 ng/ml) for 20 min prior to harvest. Follow reaction of antibody with a 1:2000 dilution of HRP Goat-a-Rabbit IgG for visualization.
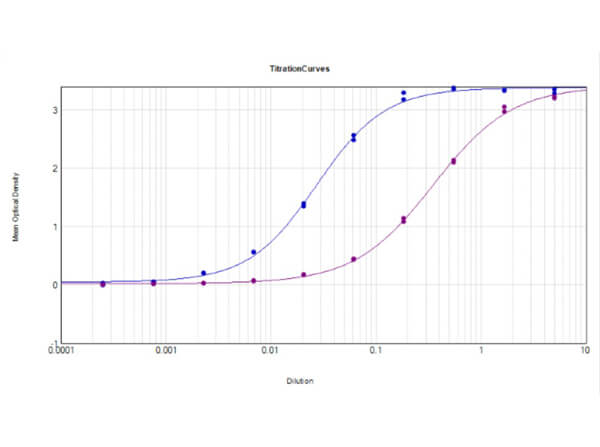
ELISA Results of Rabbit Anti-mTOR pS2448 Antibody tested against BSA-conjugated non-phospho [purple line] and phospho [blue line] forms of immunizing peptide. Each well was coated in duplicate with either 0.1μg of conjugate. The working dilution is 1:37,000. The starting dilution of antibody was 5μg/ml and the X-axis represents the Log10 of a 3-fold dilution. This titration is a 4-parameter curve fit where the IC50 is defined as the titer of the antibody. Assay performed using HRP conjugate stabilizer (p/n MB-067), Goat Anti-Rabbit HRP conjugated (p/n 611-103-122) and TMB substrate (p/n TMBE-1000).
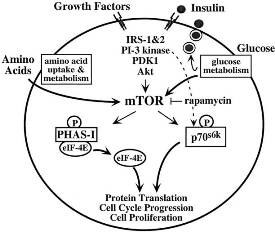
Metabolic and autocrine regulation of the mTOR pathway by Beta-cells.
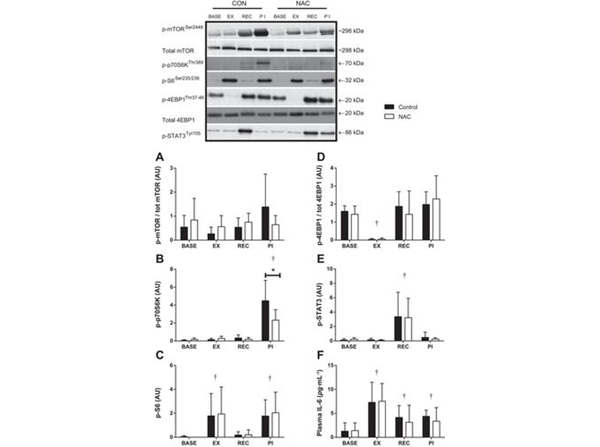
Effect of exercise and insulin stimulation with NAC or CON infusion on phosphorylation of protein translation regulation proteins mTOR Ser2448?(A), p70S6K Thr389?(B), S6 Ser235/236?(C), eukaryotic initiation factor 4E-binding protein 1 (4E-BP1) Thr37/46?(D), and STAT3 Tyr705?(E). Western blots normalized to Ponceau S stain for each lane, and representative blots from 1 participant are shown. Data are means ± SD for?n?= 7. *Significantly different, NAC vs. CON (P?< 0.05); †significantly different from BASE (P?< 0.05). Fig 6. PMID:?26105008
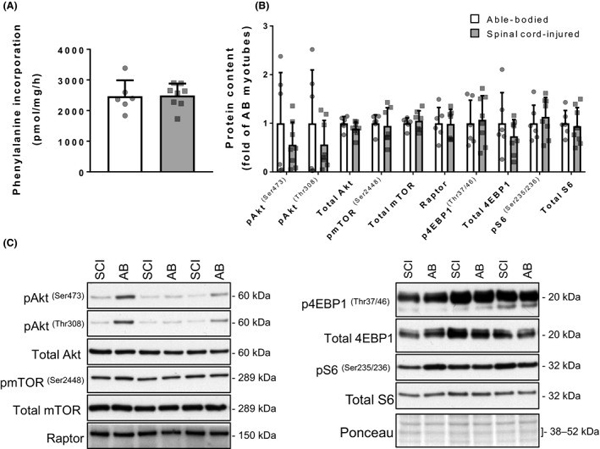
Protein synthesis in differentiated myotubes. (A) Phenylanine incorporation into protein in myotubes from spinal cord‐injured (gray bars) and able‐bodied (white bars) individuals. Bars represent mean?±?SD and individual data points are overlaid. (B) Phosphorylated and total protein content of molecules in the Akt‐mTOR signalling axis (pAkt(Ser473), pAkt(Thr308), total Akt, mTOR?(Ser2448), total mTOR, Raptor, p4EBP1(Ser37/46), total 4EBP, pS6(Ser235/236), total S6) in myotubes from spinal cord‐injured (gray bars) and able‐bodied (white bars) individuals. Bars represent mean?±?SD and individual data points are overlaid.?n?=?6?8; Mann?Whitney test (significance?P?<?0.05). (C) Representative Western blot images. mTOR, mechanistic target of rapamycin; 4EBP, 4E binding protein. Fig 3. PMID:?29906337
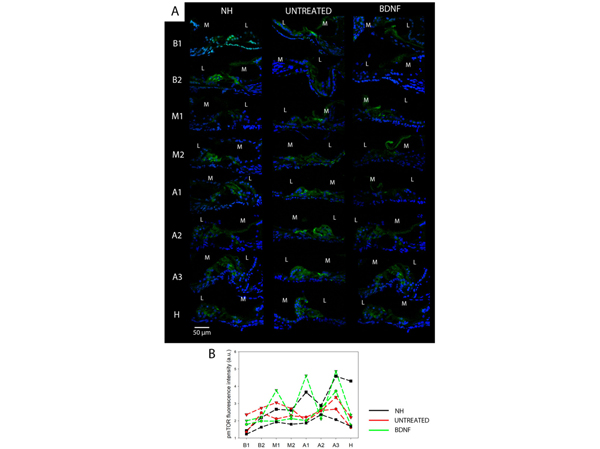
Immunolocalization and fluorescence intensity of pmTOR. (A) Representative confocal images showing the organ of Corti immunolabelled with anti-pmTOR (green) and counterstained with bisbenzimide nuclear dye (blue) of all experimental groups and for each cochlear location (from B1 to H). Scale bar: 50 μm. L: lateral, M: medial. (B) Fluorescence intensity analysis of pmTOR immunostaining. The graph shows the signal intensity of each sample for all cochlear locations (black: NH, red: untreated, green: BDNF-treated). The same symbol was used to identify the BDNF-treated and untreated ears of individual animals. Fig 8.PMID:?36428503
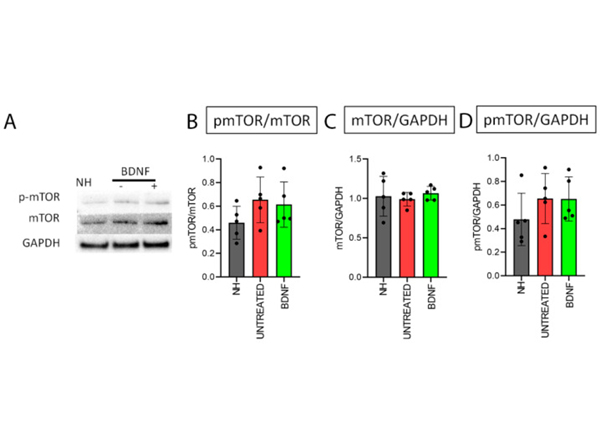
Protein quantification of pmTOR (p/n 600-401-422) and mTOR (p/n 600-401-897). (A) Representative Western blot bands (original Western blot bands are shown in?Supplementary Figure S2). Western blot analysis of pmTOR/mTOR (B), mTOR/GAPDH (C) and pmTOR/GAPDH (D) on organ of Corti samples from all the experimental groups. Histograms show mean ± SD; the dots indicate the densitometric values for individual samples (n?= 5; each sample is a pool of two organs of Corti). Fig 11.PMID:?36428503
|
|
|
|
Rockland's affinity purified anti-mTOR pS 2448 antibody was used at 5 μg/ml to detect signal in a variety of tissues including multi-human, multi-brain and multi-cancer slides. This image shows moderate staining of proximal convoluted tubules of the kidney (40X). Tissue was formalin-fixed and paraffin embedded. The image shows localization of the antibody as the precipitated red signal, with a hematoxylin purple nuclear counterstain. Personal Communication, Tina Roush, LifeSpanBiosciences, Seattle, WA.
|
|
| 別品名 |
rabbit anti-mTOR pS2448 antibody, FKBP12 rapamycin complex associated protein antibody, Serine/threonine-protein kinase mTOR, FK506-binding protein 12-rapamycin complex-associated protein 1, Mammalian target of rapamycin, mTOR, Mechanistic target of rapamycin, Rapamycin and FKBP12 target 1, Rapamycin target protein 1, FRAP, FRAP1, FRAP2, RAFT1, RAPT1
|
| 交差種 |
Human
|
| 適用 |
Western Blot
Enzyme Linked Immunosorbent Assay
Immunohistochemistry
|
| 免疫動物 |
Rabbit
|
| 抗原部位 |
a.a.2440-2457
|
| 標識物 |
Unlabeled
|
| 精製度 |
Affinity Purified
|
| 翻訳後修飾 |
リン酸化
|
| GENE ID |
2475
|
| Accession No.(Gene/Protein) |
1169735, P42345
|
| Gene Symbol |
MTOR
|
| 参考文献 |
[[Cosmo Reference Collection]][Pub Med ID]26105008,29906337,36428503
|
| [注意事項] |
濃度はロットによって異なる可能性があります。メーカーDS及びCoAからご確認ください。
|
|
| メーカー |
品番 |
包装 |
|
RKL
|
600-401-422
|
100 UG
|
※表示価格について
| 当社在庫 |
なし
|
| 納期目安 |
約10日
|
| 保存温度 |
-20℃
|
|


