|
※サムネイル画像をクリックすると拡大画像が表示されます。
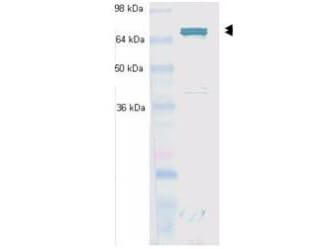
Western blot using Rockland's Protein G purified anti-Hsc70 (Hsp73) antibody shows detection of Hsc70 (Hsp73) in whole cell lysates from heat shocked HeLa cells. The band marked by the double arrowheads corresponds to Hsc70 (Hsp73) at an approximate molecular weight of 72/73 kDa. The primary antibody was used at a 1:1,000 dilution.
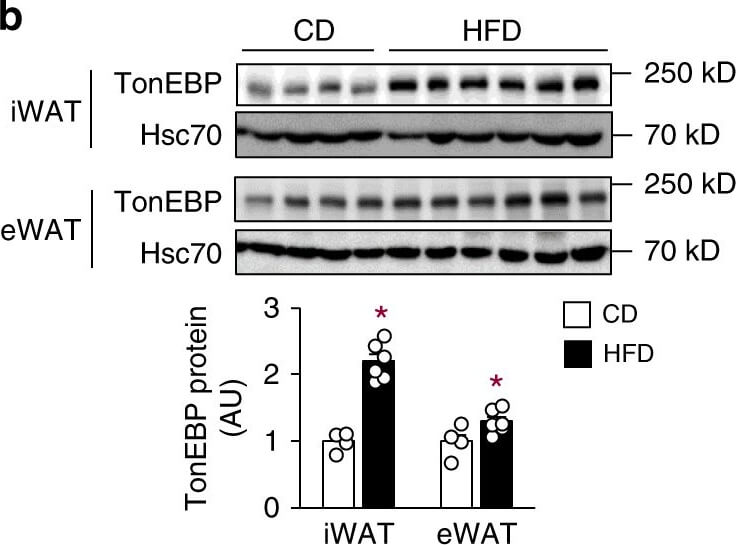
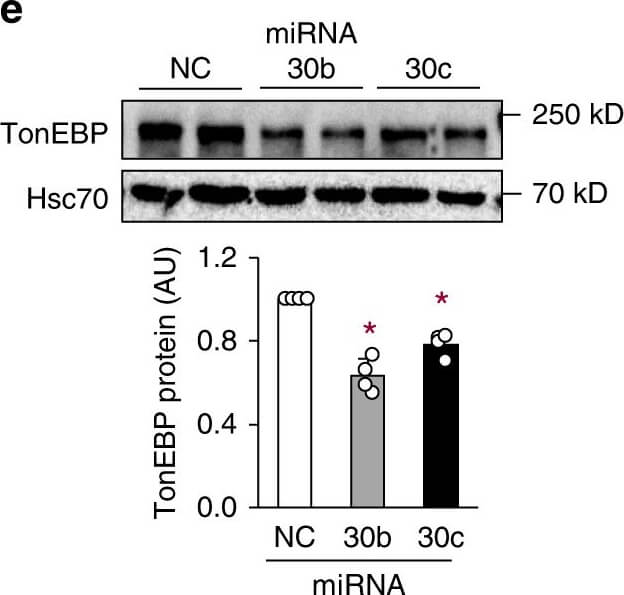
Adipocyte TonEBP expression is elevated in obesity and TonEBP-deficient mice resist obesity. aTonEBP mRNA levels in iWAT, eWAT, BAT, muscle, and liver from C57BL/6?J mice fed with CD (chow diet, n?=?5) or HFD (high-fat diet, n?=?7) for 16 weeks. b Immunoblots (top) and quantification of protein levels (bottom) of TonEBP and Hsc70 in iWAT and eWAT (CD, n?=?4; HFD, n?=?6). c Correlation of TONEBP mRNA levels in human subcutaneous adipocytes and BMI (n?=?15). TonEBP mRNA (d) and representative immunoblots (e, top) and quantification of protein levels (e, bottom) in 3T3-L1 adipocytes transfected with miR-negative control (NC), miR-30b (30b), or miR-30c (30c) (n?=?4). f?iTonEBP+/Δ mice (?+?/Δ) and their TonEBP+/+ littermates (+/+) were fed with CD or HFD as indicated. f Changes in body weight after a switch to HFD (CD+/+, n?=?7; CD?+?/Δ, n?=?7; HFD+/+, n?=?13; HFD+/Δ, n?=?11). g Representative images of animals fed with HFD. h Body weight, height, fat mass, and lean mass (n?=?8). i Representative images (top) and weight (bottom) of fat pads from HFD-fed animals (n?=?4). n represents number of biologically independent samples (a?c, i) or animals (f?h) or independent experiments with triplicate (d, e). All data are presented as mean?+?s.e.m. (a, b, f, h, i) or?+?s.d. (d, e). AU, arbitrary unit. The p-values are determined by unpaired t-test (a,b, h, i) or one-way ANOVA (d?f). *p?<?0.05 vs. CD (a), NC (d), or +/+?(f, h, i). Source data are provided as a Source Data file Figure provided by CiteAb. Source: Nat Commun, PMID: 31387996.
Adipocyte TonEBP expression is elevated in obesity and TonEBP-deficient mice resist obesity. aTonEBP mRNA levels in iWAT, eWAT, BAT, muscle, and liver from C57BL/6?J mice fed with CD (chow diet, n?=?5) or HFD (high-fat diet, n?=?7) for 16 weeks. b Immunoblots (top) and quantification of protein levels (bottom) of TonEBP and Hsc70 in iWAT and eWAT (CD, n?=?4; HFD, n?=?6). c Correlation of TONEBP mRNA levels in human subcutaneous adipocytes and BMI (n?=?15). TonEBP mRNA (d) and representative immunoblots (e, top) and quantification of protein levels (e, bottom) in 3T3-L1 adipocytes transfected with miR-negative control (NC), miR-30b (30b), or miR-30c (30c) (n?=?4). f?iTonEBP+/Δ mice (?+?/Δ) and their TonEBP+/+ littermates (+/+) were fed with CD or HFD as indicated. f Changes in body weight after a switch to HFD (CD+/+, n?=?7; CD?+?/Δ, n?=?7; HFD+/+, n?=?13; HFD+/Δ, n?=?11). g Representative images of animals fed with HFD. h Body weight, height, fat mass, and lean mass (n?=?8). i Representative images (top) and weight (bottom) of fat pads from HFD-fed animals (n?=?4). n represents number of biologically independent samples (a?c, i) or animals (f?h) or independent experiments with triplicate (d, e). All data are presented as mean?+?s.e.m. (a, b, f, h, i) or?+?s.d. (d, e). AU, arbitrary unit. The p-values are determined by unpaired t-test (a,b, h, i) or one-way ANOVA (d?f). *p?<?0.05 vs. CD (a), NC (d), or +/+?(f, h, i). Source data are provided as a Source Data file Figure provided by CiteAb. Source: Nat Commun, PMID: 31387996.
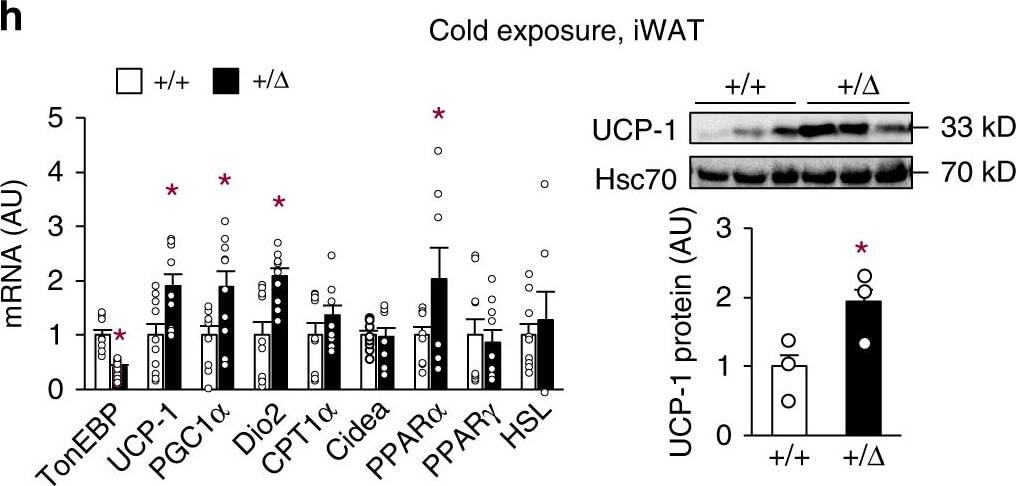
TonEBP deficiency promotes energy expenditure and beiging of WAT. HFD-fed animals were analyzed by indirect calorimetry to obtain VO2 (a), VCO2 (b), and heat production (c) (n?=?4). Rectal temperature (temp.) measured in CD-fed animals at room temperature (n?=?8) (d) and after exposure to cold up to 6?h as indicated (4?°C) (n?=?6) (e). f, g mRNA abundance of thermogenic genes (f) and beiging marker genes (g) in iWAT of HFD-fed animals (n?=?5). h mRNA abundance of thermogenic genes (left, n?=?10) and immunoblots of UCP-1 and Hsc70 (right, n?=?3) in iWAT of CD-fed animals exposed to cold (4?°C). i Representative images of iWAT sections stained with H&E and UCP-1 antibody from CD-fed animals exposed to cold (4?°C). Scale bars, 100?μm. j, k Thermogenic gene (j) and beige marker (k) mRNA abundance in beige adipocytes differentiated from the stromal vascular cells of iWAT (n?=?4). n represents number of biologically independent animals (a?e) or samples (f?k). a?h, j, k All data are presented as mean?+?s.e.m. AU arbitrary unit. The p-values are determined by unpaired t-test (d, f?k) or one-way ANOVA (a?c, e). *p?<?0.05 vs. +/+. Source data are provided as a Source Data file Figure provided by CiteAb. Source: Nat Commun, PMID: 31387996.
|
|
|
|
Western blot using Rockland's Protein G purified anti-Hsc70 (Hsp73) antibody shows detection of Hsc70 (Hsp73) in whole cell lysates from heat shocked HeLa cells. The band marked by the double arrowheads corresponds to Hsc70 (Hsp73) at an approximate molecular weight of 72/73 kDa. The primary antibody was used at a 1:1,000 dilution.
|
|
| 別品名 |
Heat shock cognate protein 71-kDa antibody, Heat shock protein 8 antibody, Heat-shock70-KD protein 10, formerly antibody, HSC54 antibody, HSC71 antibody, Hsc54, Hsc71, Hsc73, Hsp71, Hsp73, HspA10, HspA8, LAP1, NIP71, Heat shock cognate 71 kDa protein, Heat shock 70 kDa protein 8
|
| 交差種 |
Human
Mouse
Rat
Bovine
Rabbit
Porcine
Chicken
Canine
Sheep
Monkey
Guinea Pig
Hamster
Beluga
Caenorhabditis elegans
Carp
|
交差種以外の
交差情報
(微交差など) |
[Reactivity]Cucumber, D. melanogaster, Pea, Salmon, Trout, Xenopus
|
| 適用 |
Western Blot
Immunohistochemistry
Immuno Fluorescence
Flow Cytometry
Immunoprecipitation
|
| 免疫動物 |
Mouse
|
| クローン |
N27F3-4
|
| 抗体クラス |
IgG1
|
| 標識物 |
Unlabeled
|
| 精製度 |
Ig fraction - Protein G
|
| GENE ID |
3312
|
| Accession No.(Gene/Protein) |
NP_006588.1, P11142
|
| Gene Symbol |
HSPA8
|
| 参考文献 |
[Pub Med ID]31387996
|
| [注意事項] |
濃度はロットによって異なる可能性があります。メーカーDS及びCoAからご確認ください。
|
|
| メーカー |
品番 |
包装 |
|
RKL
|
200-301-A28
|
100 UG
|
※表示価格について
| 当社在庫 |
なし
|
| 納期目安 |
約10日
|
| 保存温度 |
-20℃
|
|