
| 別品名 |
TATA-box-binding protein, TATA sequence-binding protein, TATA-binding factor, TATA-box factor, Transcription initiation factor TFIID TBP subunit, GTF2D1, TF2D, TFIID
|
| 抗原部位 |
N-terminus
|
| 種由来 |
Human
|
| 標識物 |
Unlabeled
|
| 精製度 |
Ig fraction - Ammonium Sulphate
|
| 適用 |
Western Blot
Chromatin Immunoprecipitation
|
| 免疫動物 |
Mouse
|
| 抗体クラス |
IgG1
|
| 交差種 |
Human
|
| GENE ID |
6908
|
| Accession No.(Gene/Protein) |
NP_001165556, P20226
|
| Gene Symbol |
TBP
|
| 形状 |
滅菌済み液状品
|
| 参考文献 |
Marks H, Chow JC, Denissov S, Francoijs KJ, Brockdorff N, Heard E and Stunnenberg HG (2009) High-resolution analysis of epigenetic changes associated with X inactivation. Genome Res 19: 1361-1373. Denissov S, van Driel M, Voit R, Hekkelman M, Hulsen T, Hernandez N, Grummt I, Wehrens R and Stunnenberg H (2007) Identification of novel functional TBP-binding sites and general factor repertoires EMBO J 26: 944-954. Raha T, Cheng SWG and Green MR (2005) HIV-1 Tat stimulates transcription complex assembly through recruitment of TBP in the absence of TAFs. PLoS Biol 3: e44. Ruppert SM, McCulloch V, Meyer M, Bautista C, Falkowski M, Stunnenberg HG and Hernandez N (1996) Monoclonal antibodies directed against the amino-terminal domain of human TBP cross-react with TBP from other species. Hybridoma 15: 55-68.
|
| [注意事項] |
濃度はロットによって異なる可能性があります。メーカーDS及びCoAからご確認ください。
|
|
※サムネイル画像をクリックすると拡大画像が表示されます。
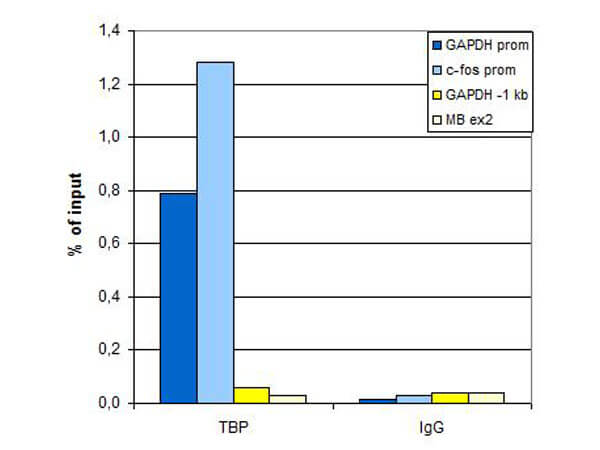
Chromatin Immunoprecipitation was performed with 5 ug of anti TBP antibody on sheared chromatin from 1 million HeLaS3 cells on the IP Star automated system. The IP'd DNA was analyzed by QPCR with optimized PCR primer pairs for the promoters of the active GAPDH and c fos genes, used as positive control targets, and for a region 1 kb upstream of the GAPDH promoter and the coding region of the inactive MB gene, used as negative control targets (figure A). The IP'd DNA was subsequently analyzed with an Illumina Genome Analyzer. The 36 bp tags were aligned to the human genome using the ELAND algorithm. Figure shows the peak distribution in 50 kb regions surrounding the GAPDH, c fos, ACTB and MCL1 genes (figure B, C, D and E, respectively). These results clearly show a localization of TBP at the promoters of actively transcribed genes.
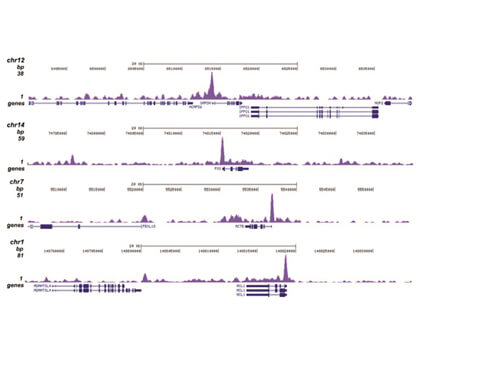
Chromatin Immunoprecipitation was performed with 5 μg of anti-TBP antibody on sheared chromatin from 1 million HeLaS3 cells on the IP-Star automated system. The IP'd DNA was analysed by QPCR with optimized PCR primer pairs for the promoters of the active GAPDH and c-fos genes, used as positive control targets, and for a region 1 kb upstream of the GAPDH promoter and the coding region of the inactive MB gene, used as negative control targets (figure A). The IP'd DNA was subsequently analyzed with an Illumina Genome Analyzer. The 36 bp tags were aligned to the human genome using the ELAND algorithm. Figure shows the peak distribution in 50 kb regions surrounding the GAPDH, c-fos, ACTB and MCL1 genes (figure B, C, D and E, respectively). These results clearly show a localisation of TBP at the promoters of actively transcribed genes.
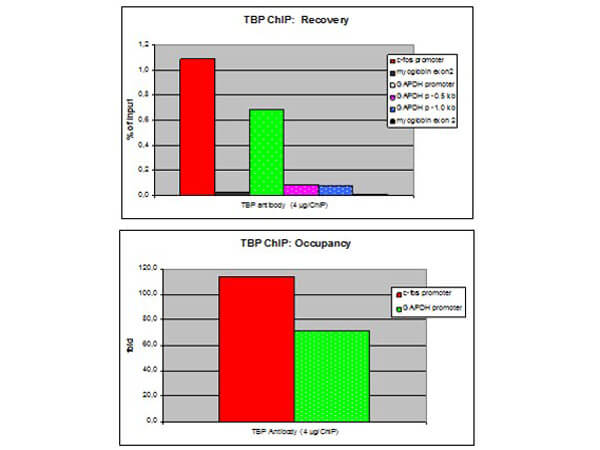
ChIP assays were performed using U2OS cells, TBP antibody, and optimized primer sets for qPCR. Sheared chromatin from 1x10e6 cells and 4 ug of antibody were used per experiment. QPCR was performed with primers for the promoter of the c-fos and GAPDH genes, a region 0.5 and 1 kb upstream of the GAPDH promoter, and for exon 2 of the myoglobin gene as a negative control. This figure shows the recovery (the relative amt of IP DNA compared to input DNA) and the occupancy (ratio +/- control target). These results demonstrate the occupancy of both promoters by TBP.
|
|
|
|
Chromatin Immunoprecipitation was performed with 5 ug of anti TBP antibody on sheared chromatin from 1 million HeLaS3 cells on the IP Star automated system. The IP'd DNA was analyzed by QPCR with optimized PCR primer pairs for the promoters of the active GAPDH and c fos genes, used as positive control targets, and for a region 1 kb upstream of the GAPDH promoter and the coding region of the inactive MB gene, used as negative control targets (figure A). The IP'd DNA was subsequently analyzed with an Illumina Genome Analyzer. The 36 bp tags were aligned to the human genome using the ELAND algorithm. Figure shows the peak distribution in 50 kb regions surrounding the GAPDH, c fos, ACTB and MCL1 genes (figure B, C, D and E, respectively). These results clearly show a localization of TBP at the promoters of actively transcribed genes.
|
|
|
| メーカー |
品番 |
包装 |
|
RKL
|
200-301-W44
|
100 UG
|
※表示価格について
| 当社在庫 |
なし
|
| 納期目安 |
約10日
|
| 保存温度 |
-20℃
|
|